Category

Energy finance

Category

This new in-depth analysis of Asia-Pacific green economic transition analyzes cleantech and green trade, investment in manufacturing and utilization of solar, wind, batteries, New Energy Vehicles (NEVs) and related equipment. It is co-written by Christoph Nedopil (UQ), Michael Davidson (UCSD), Jieune O’Neill (UCSD), Andres Perez-Corsini (UCSD), Sandy Qian (UCSD), and Tong Niu (UQ).

Highlights of Asia-Pacific Green and Cleantech trade, manufacturing investment and utilization

Asia Pacific (APAC) economies are going through a green transition, which requiresbalancinggreen tech utilization (e.g., green energy installations), strengthening domestic green tech manufacturing, and expanding green tech trade to import readily available cleantech and/or export domestically produced cleantech.

Across APAC, economies are following distinct green transition pathways. India and Viet Nam combine strong green technology deployment with manufacturing development; Australia, Pakistan and the Philippines rely more heavily on imported technologies; Malaysia and Thailand have export-oriented manufacturing profiles; Indonesia is emerging as a local value-adding economy, driven by substantial manufacturing investment despite lower deployment and net imports; Bangladesh remains a low-intensity transition economy.

Renewable energy deployment has been led by India, Australia and Viet Nam. Between 2015 and 2025, India added 172 GW of renewable capacity, representing 72% of its net capacity additions, while Australia added 48 GW. Viet Nam added 32 GW between 2015 and 2024, although 89% of its solar expansion was concentrated in 2019–2020. By contrast, Indonesia added only 4.1 GW of renewables compared with 31.4 GW of coal capacity.

Electric mobility is expanding fastest in Viet Nam and India. Growth has been driven particularly by electric two- and three-wheelers, with the Philippines also seeing increasing adoption in these segments. Viet Nam recorded rapid electric-car adoption, with EVs accounting for more than 10% of its passenger-car stock in 2025, while adoption remained limited in Indonesia and Malaysia.

Green technology trade reflects different levels of industrial integration. Australia, Pakistan, Bangladesh and the Philippines remain predominantly import-dependent; India, Indonesia and Thailand combine substantial imports and exports; and Viet Nam and Malaysia have developed more export-oriented profiles. Nevertheless, most economies remain highly dependent on China, including for more than 60% of EV and battery imports in most cases. Furthermore, many exporting economies are subject to volatility in U.S. trade policies.

Green technology manufacturing investment has accelerated since 2021 but remains concentrated in specific economies and technologies. Indonesia and India attracted the largest announced investment volumes, with battery manufacturing dominating recent announcements. China is the main source for APAC (ex China) cleantech manufacturing investments, particularly in Malaysia, Thailand and Indonesia where it accounted for 50% of identified battery manufacturing projects.

Deployment, manufacturing and trade should be treated as complementary but distinct policy objectives. Investment announcements and trade surpluses do not necessarily translate into domestic production, employment or technological capability; policies should therefore target competitive value-chain segments while avoiding measures that unnecessarily slow green technology deployment.

Introduction – the Green Economy Transition Triplet

Governments across Asia-Pacific pursue two related objectives: accelerating the deployment of clean technologies such as solar, wind, and electric vehicles, while many aim to capture greater economic value by building domestic cleantech manufacturing capacity rather than relying on readily available, often cheaper imports. India, for example, aims to establish a self-reliant clean energy manufacturing system including a complete indigenous solar value chain by 2028, while Indonesia aims to attract green manufacturing investment by implementing local content requirements (TKDN) for green electricity projects.

However, the objectives of fast cleantech deployment and domestic manufacturing capacity may pull policy in different directions: The demand for rapid renewable energy and electric mobility deployment can often be satisfied through readily available low-cost imports—especially from China. Meanwhile, strategies focused on building domestic manufacturing capacity may require strong domestic demand for domestically produced clean technologies or strong export opportunities, and they often need to overcome competitive disadvantages vis-à-vis Chinese manufacturers. Building domestic manufacturing capacity thus may require investment support, market protection, local-content measures to generate demand, as well as time to establish competitive supply chains. For policymakers, it is important to understand how to navigate the opportunities and challenges in their green economic transition, balancing green tech utilization, green local manufacturing, as well as green trade through imports and exports. The Figure below shows how these three factors interact in the “green economic transition triplet”: Optimizing for any of these dimensions will have positive or negative interactions with other dimensions. For example, focusing on domestic content requirements for green tech utilization aims to spur green manufacturing and reduce imports. However, without sufficient domestic demand for clean technologies, investors will not build cleantech factories, and greentech utilization will decelerate.
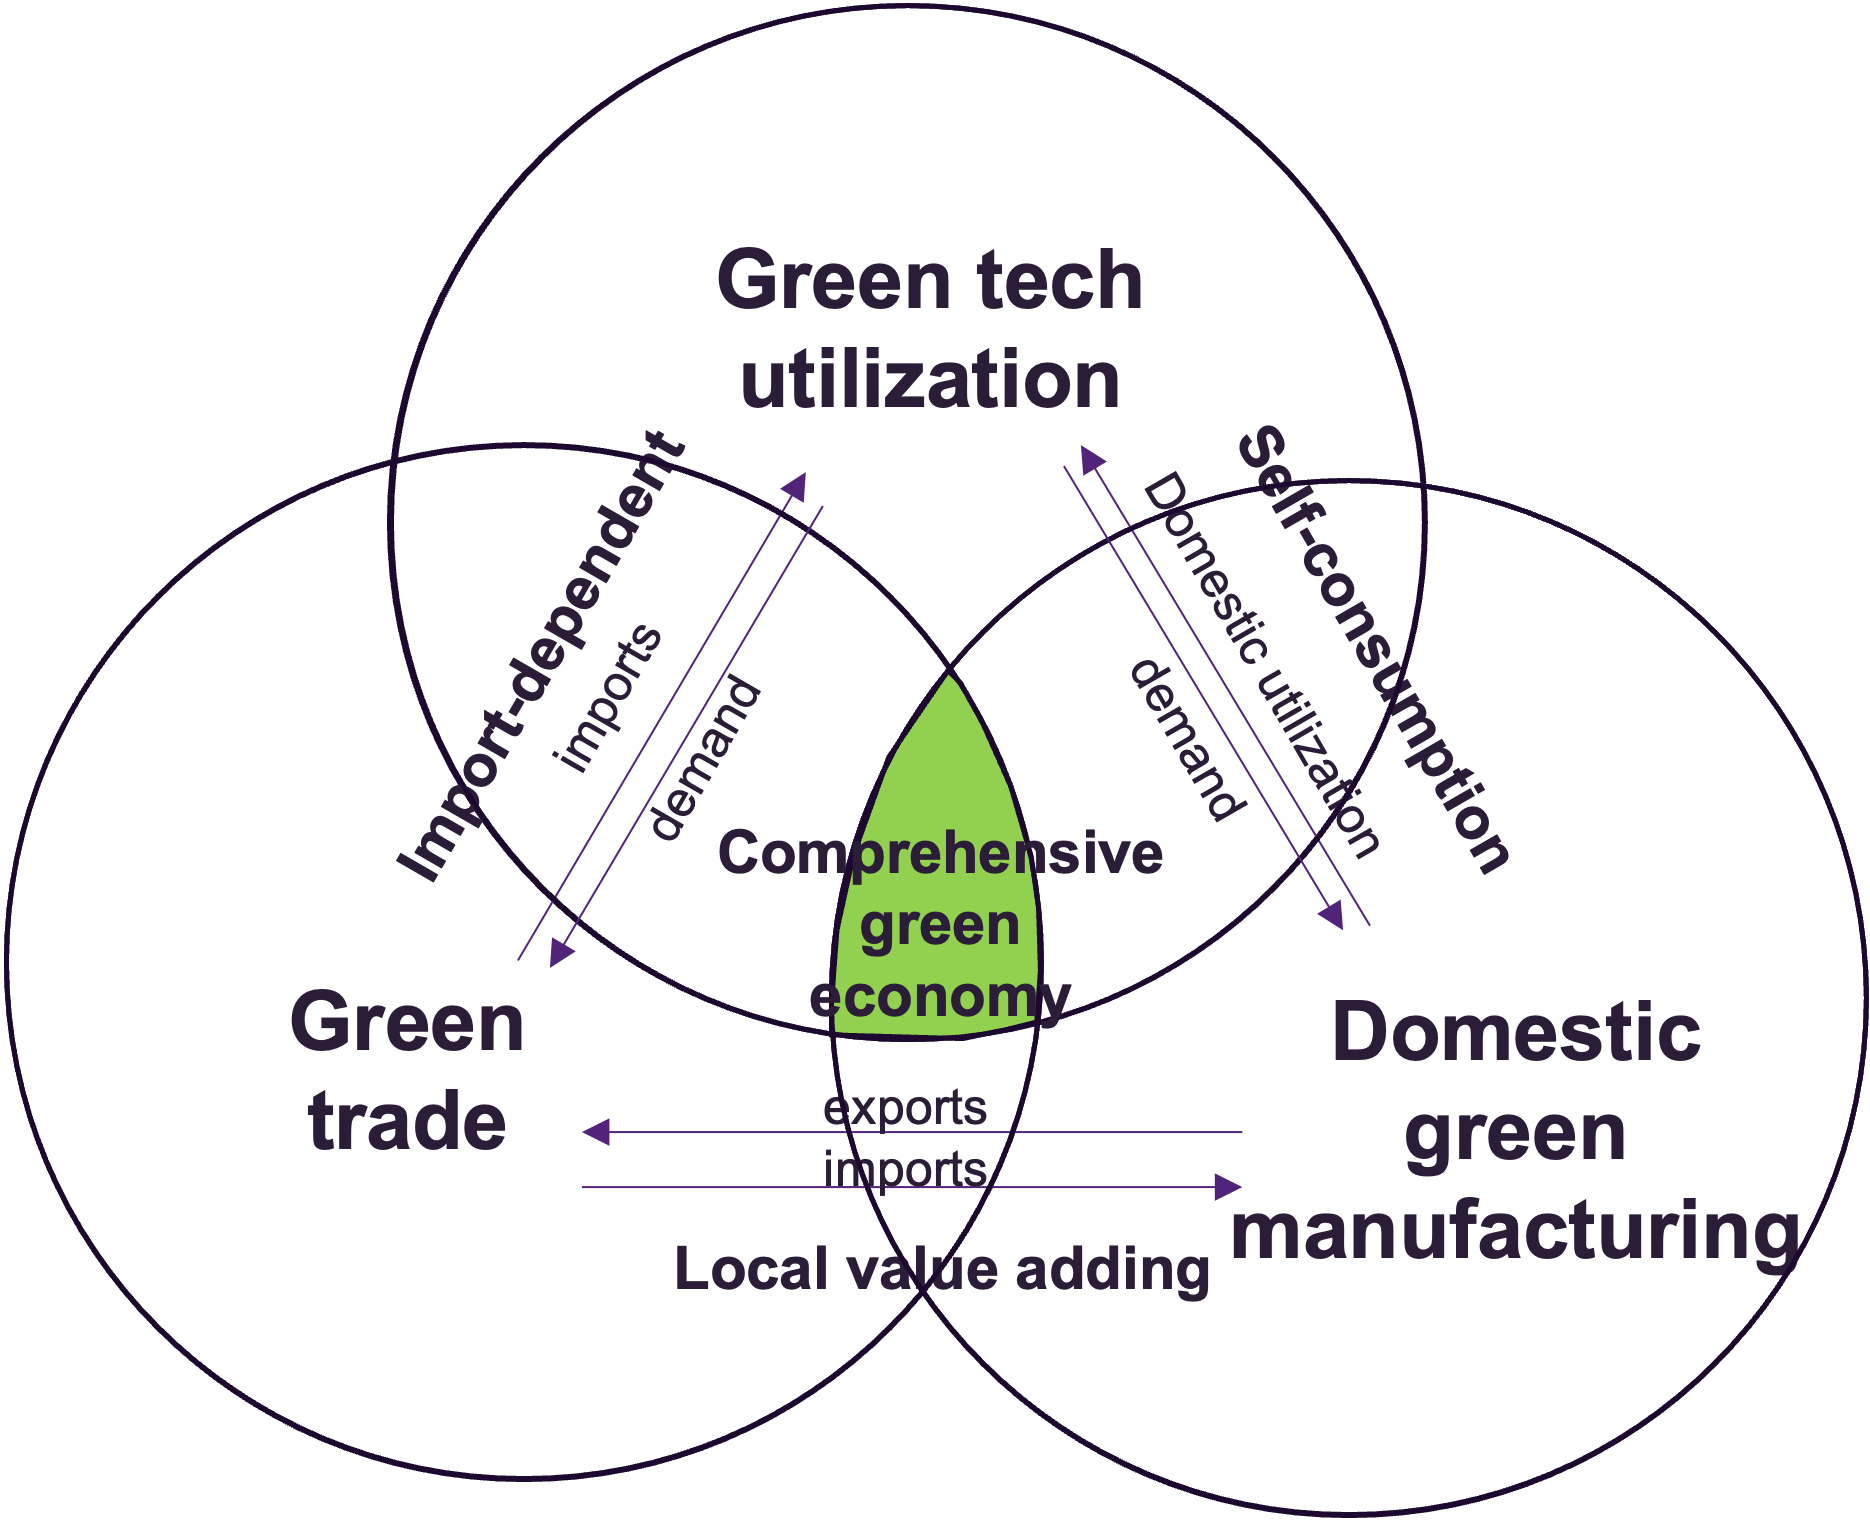
Green economy transition triplet

The green economic transition triplet suggests five green transition pathways:

  1. Import-dependent economies that utilize green imports to strengthen the green economic transition without relevant domestic green manufacturing
  2. Self-consumption economies that build green manufacturing capacity for domestic use
  3. Local value-adding economies that have significant green manufacturing capacity (mostly assembly) to add value to imported semi-finished products for export
  4. Comprehensive green economies that have built a strong green ecosystem that boasts green manufacturing capacity with strong domestic utilization and trade
  5. Low-intensity transition economies without significant focus on any green transition factor.

To understand how Asia-Pacific (APAC) economies are addressing the green economic transition, this report analyzes the latest available data of nine APAC economies (Australia, Bangladesh, India, Indonesia, Malaysia, Pakistan, the Philippines, Thailand and Viet Nam) across the three dimensions of green economic transition:

  1. Domestic deployment of renewable-energy technologies and new energy vehicles with data from 2015 to H1 2026;
    1. Cross-border trade in selected low-carbon technology products (with comparisons to the USA and China) with data from 2002 to 2025; and
    1. Domestic cleantech manufacturing investment in solar, wind, battery and EV manufacturing with data from 2015 to H1 2026.

We find economies across Asia-Pacific have typically adopted one of the pathways to optimize this transition triplet.

We also acknowledge important limitations of this approach as the three indicators do not measure all dimensions of green industrial development. In particular, trade balances do not directly measure domestic value added, and investment announcements do not necessarily translate into operating production capacity, employment or technology transfer. The framework therefore identifies indicative development profiles rather than ranking countries’ policy success.

Green Technology Utilization Trends in Asia-Pacific

The following chapter analyzes how economies across Asia-Pacific utilize green technologies related to electricity generation and transportation.

Green Electricity Utilization

All nine analyzed APAC economies have expanded power generation capacity. However, significant differences appear in deployment speed and technology mixes, including green energy sources.
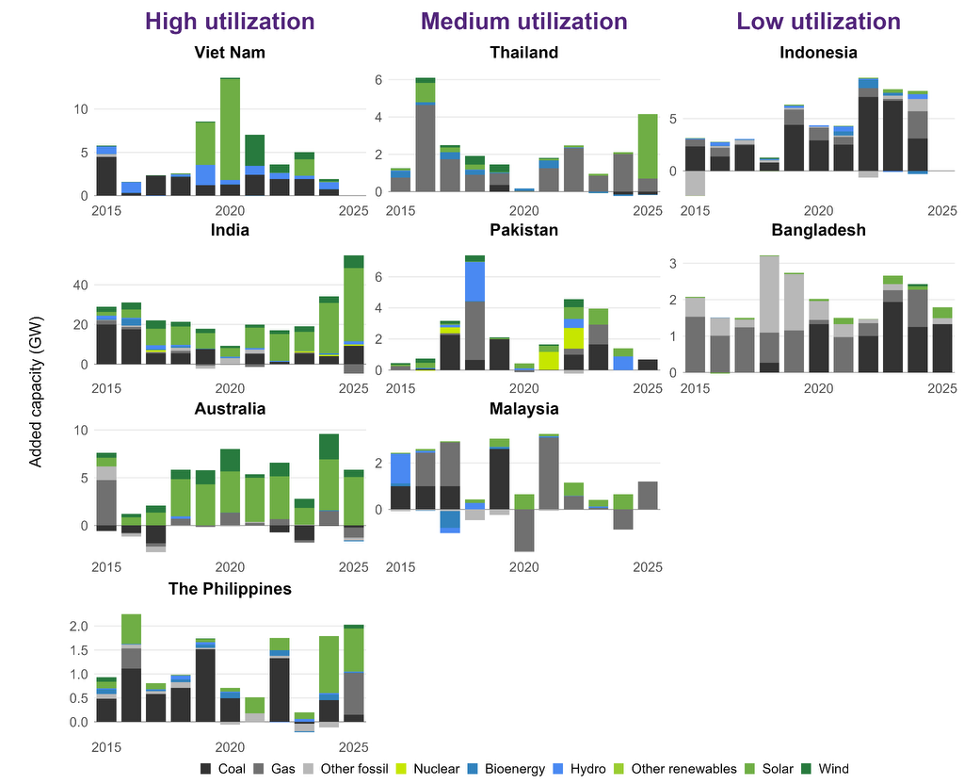
New additions of electrical generation capacity by country, 2015-2025
New additions of electrical generation capacity by country, 2015-2025, Source: Authors’ calculations using Ember’s Yearly Electricity Data.
  1. High utilization: Viet Nam, India, Australia and the Philippines have shown the strongest overall adoption. Viet Nam and, to some extent, India initially relied on hydropower before shifting towards solar, whereas Australia had an earlier start with solar and wind. Between 2015 and 2025, renewables contributed 172 GW (72%) of India’s net capacity additions, while Australia added 48 GW of renewable capacity. In Viet Nam, renewables contributed 32 GW (69%) between 2015 and 2024, with 89% of its solar growth concentrated in 2019–2020. The Philippines’ expansion was smaller but accelerated recently, adding 4.6 GW of renewable capacity, mainly solar.
  2. Medium utilization: Thailand, Pakistan and Malaysia have expanded renewable and other low-carbon technologies while continuing to rely on fossil fuels. Thailand added 8.0 GW of renewable capacity, primarily solar, but also added 15.1 GW of gas capacity. Pakistan combined 9.4 GW of renewable additions with 2.8 GW of nuclear capacity, alongside continued coal and gas expansion. Malaysia’s recent renewable growth was driven mainly by solar, while coal and gas remained dominant.
  3. Lower utilization: Indonesia and Bangladesh added relatively limited renewable capacity. Indonesia followed a diversified pathway involving hydro, bioenergy, geothermal and solar, but renewables contributed only 4.1 GW (9%) of its net capacity additions between 2015 and 2024, compared with 31.4 GW of coal. Bangladesh added approximately 1.0 GW of renewables which was mostly solar, representing only 5% of its net expansion, while most new capacity came from gas, coal and other fossil fuels.

New Energy Vehicle (NEV) Adoption

Adoption of new energy vehicles (NEVs) including cars, buses, vans and two- and three-wheelers varies significantly across the observed APAC economies:

  1. High utilization: Viet Nam and India have started to adopt NEVs, in particular two- and three-wheelers since 2015. Since 2022, cars with electric engines have also started to see stronger growth. For example, in Viet Nam, electric cars make up more than 10% of the total vehicle stock in 2025.
  2. Medium utilization: Thailand, Australia and the Philippines occupy an intermediate position. While electric vehicles accounted for approximately 2.5% of the passenger-car stock in Thailand and Australia in 2025, NEV adoption in the Philippines has been driven primarily by electric two- and three-wheelers.
  3. Slow utilization: Indonesia and Malaysia continue to rely predominantly on internal combustion engines for road transportation, with EVs accounting for less than 1% of the passenger-car stock in 2025
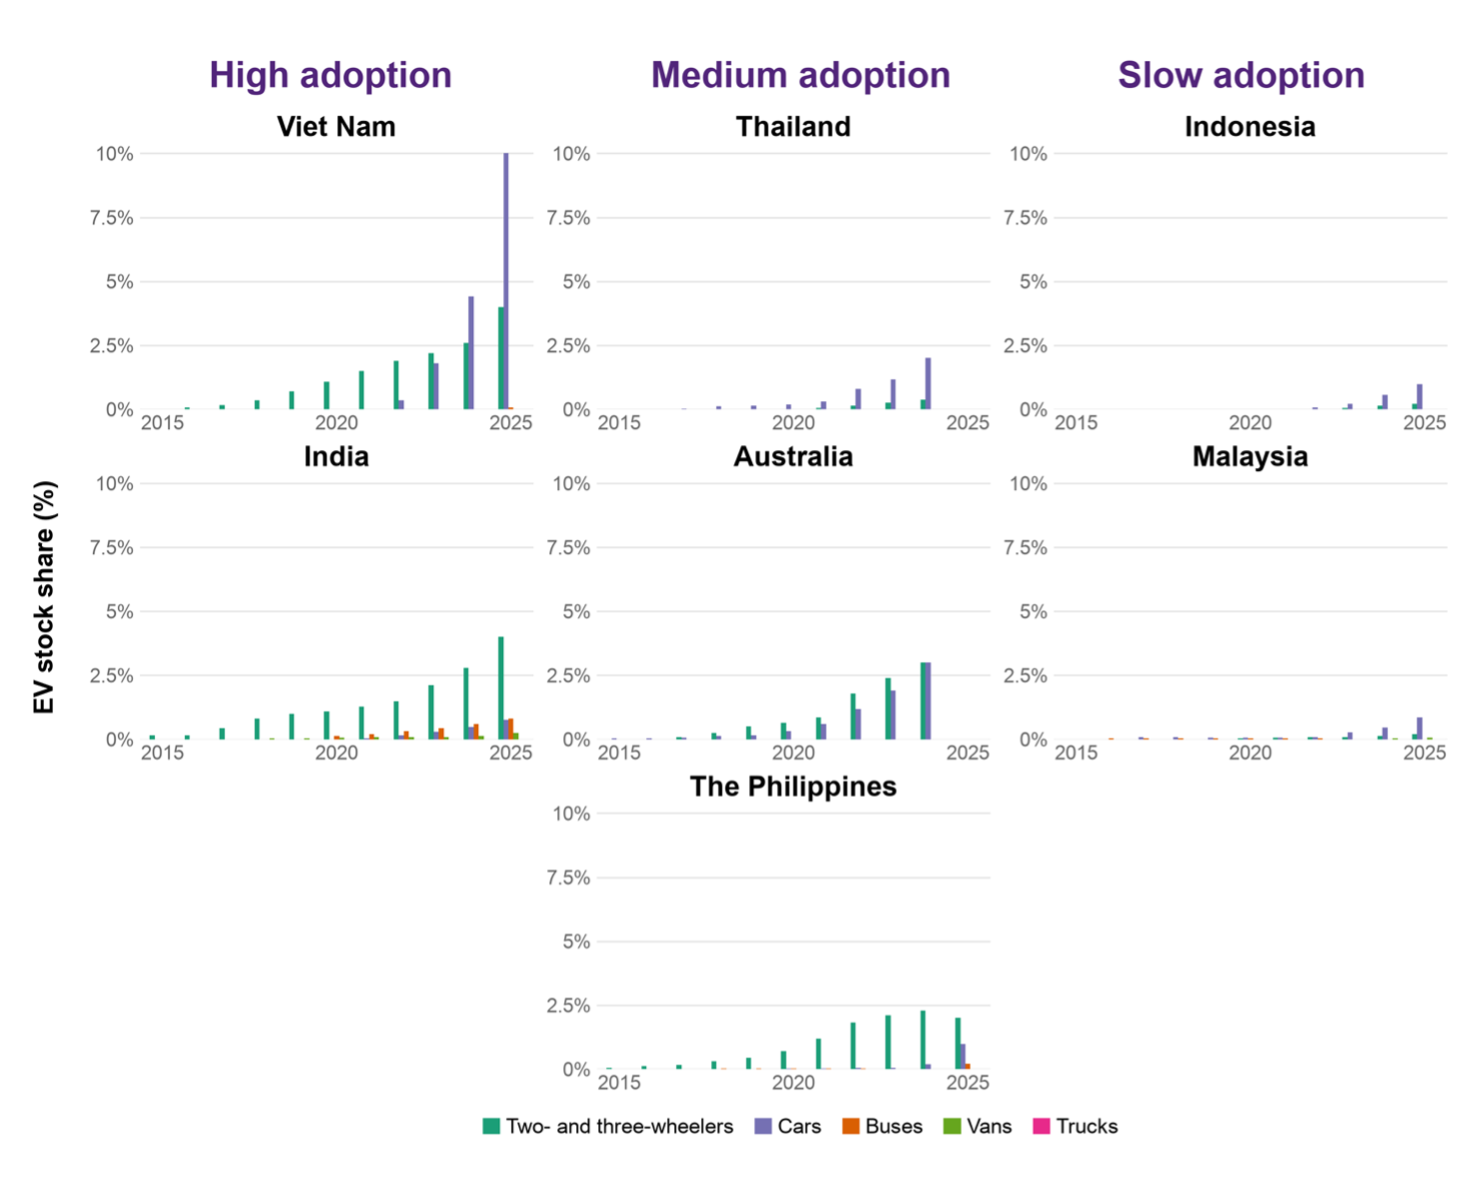
Electric vehicle adoption (as share of total vehicle stock) by country and vehicle type, 2010-2025
Note: Data not available for Pakistan and Bangladesh.
Source: Authors’ calculations using the International Energy Agency’s Global EV Outlook dataset.

Summary of Green Technology Utilization

Green technology utilization in APAC economies varies widely. Analyzing new electricity generation capacity and NEV stocks, data show three buckets of APAC economies:

  • High utilization: India and Viet Nam have relatively high utilization rates of green technology for both electricity and NEVs. Australia has high utilization rates for electricity.
  • Medium utilization: Malaysia and Pakistan have medium utilization for electricity, while Thailand, Australia and the Philippines show intermediate levels of NEV adoption.
  • Lower utilization: Bangladesh and Indonesia are mostly dependent on non-green technologies in their expansion of electricity and transportation.

Green Technology Trade and Trade Dependencies in APAC Economies

Green Technology Trade in APAC Economies

Trade in green technologies, including New Energy Vehicles (NEVs) and energy (including solar, wind, other low-carbon technologies such as nuclear, as well as grid transmission equipment), has grown rapidly across APAC economies over the past 10 years.

The figure below shows how APAC economies can be distinguished into three groups regarding their green technology trade since 2002:

  • Net importing economies: Australia is the largest net importer of cleantech, growing most rapidly in the EV/battery sectors. Pakistan and Bangladesh are similarly mostly importing and not exporting green technologies, with Pakistan increasing its renewable electricity imports rapidly over the last few years. This is similar to the Philippines, which has rapidly expanded its imports of energy-related equipment since 2025.
  • Import-export economies: Several APAC economies are both importing and exporting substantial values of green technologies. This includes Thailand, Indonesia and India. Green-technology trade patterns shifted in 2025, coinciding with new US trade restrictions affecting selected products. This led to significant falls in exports from Thailand. Meanwhile, India witnessed a surge in imports of EVs and renewable energy technology with relatively flat exports. Indonesia saw a near doubling of exports compared to 2024. Some of this is the U.S. market for solar and battery exports (explored below) and the intermediate inputs to fuel this manufacturing growth.
  • Export-oriented countries: Viet Nam and  Malaysia have expanded exports over the past five years, coupled with imports of intermediate components. Changes in export regimes driven by U.S. trade restrictions also affected green technology exports from Viet Nam and Malaysia in 2025.
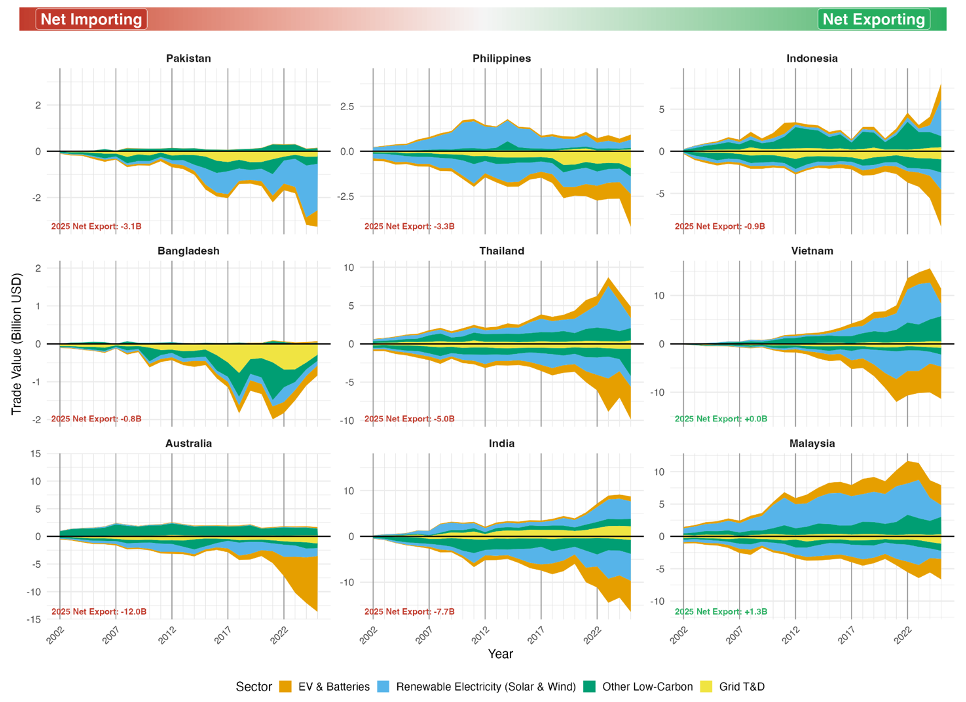
Low-carbon technology trade by country and sector, 2002-2025.
Source: Authors’ calculations using CEPII-BACI for 2002–2024 and harmonized UN Comtrade and General Administration of Customs of China data for 2025.
Note: Exports are shown above zero and imports below zero. Economies are ordered from net-importing to net-exporting. Trade values are reported in current USD.

APAC Green Technology Trade Dependencies

China has emerged as the world’s most important source of green technologies, which also includes APAC economies.

The figure below shows how different APAC economies are dependent on China as a source of their green technology imports in 2025. For example, 99% of Pakistan’s solar equipment imports came from China. Similarly, all APAC economies sourced over 60% of their NEVs and battery imports from China (with the exception of Malaysia for batteries).

While these data show high supplier concentration on China providing the majority of imports of green technologies, the data do not, on their own, measure broader economic dependence on Chinese suppliers as domestic suppliers might also provide significant shares of green technology.
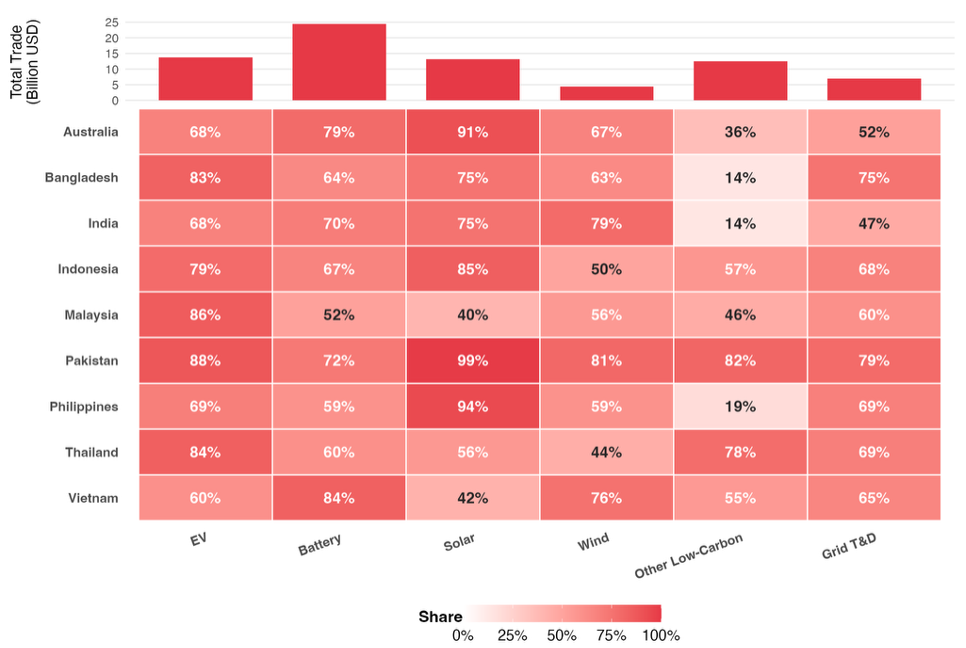
China’s share of low-carbon technology imports by economy and technology, 2025.
Source: Author calculations using UN Comtrade and GACC harmonized (2025).
Note: This figure displays economies’ dependence on Chinese products in LCT technologies as a share of their total imports in that category. Economies might have lower economic dependence on China LCT depending on their domestic capabilities.

The U.S. is a key destination for LCT exports among the countries considered. For solar products, several countries are reliant on the U.S. for more than half of their exports (see below). Indonesia, Malaysia and Thailand are particularly dependent on the U.S. as an export destination for solar, with the country also accounting for a substantial share of India’s LCT exports across product categories. These patterns suggest that, beyond China’s dominant role as a source of LCT imports, the U.S. plays a central role as the destination market for LCT products exported by several of these countries.

At the same time, trade relations with the U.S. represent a large source of volatility. Changes in trade in 2025 are, in large part, due to increasing import tariffs by the U.S., which shifted preferred export origins from traditional suppliers (Viet Nam, Thailand, Malaysia) to newer suppliers (Indonesia). In particular, for Viet Nam, the U.S. accounted for 79% of solar exports in 2024, but this share fell to 40% in 2025 following the introduction of tariffs. However, this may not be a permanent change, as the U.S. put tariffs in place on Indonesian solar exports in late 2025, which has suppressed exports in the first half of 2026.
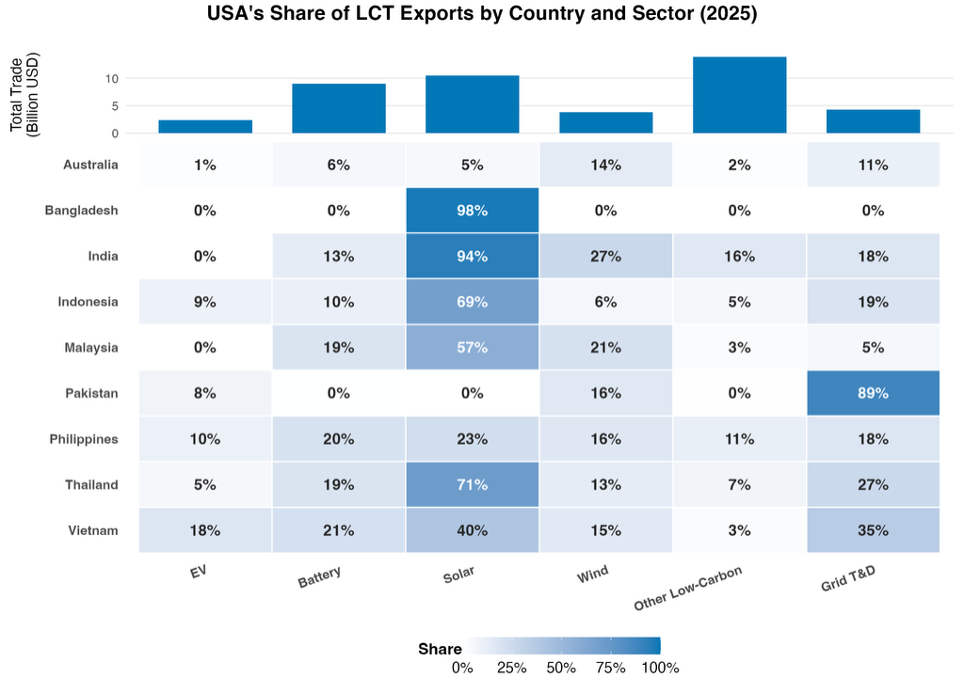
USA's share of low-carbon technology (LCT) exports by country and technology, 2025.
USA’s share of low-carbon technology (LCT) exports by country and technology, 2025.
Source: Author calculations using UN Comtrade and GACC harmonized (2025).
Note: This figure displays economies’ dependence on the USA in LCT technologies as a share of their total exports to the USA in that category. Economies might have lower economic dependence on the USA depending on their domestic capabilities.

Green Technology Manufacturing Investments in APAC and the Role of China

As the trade data above show, APAC economies have been integrated into international green technology supply chains as exporters driven by local manufacturing capabilities.

Green Technology Manufacturing Investment Trends

The figure below shows cumulative investment announcements in APAC economies from 2015 to 2026 H1. Indonesia and India attracted the largest announced investment volumes, followed by Viet Nam, Malaysia, Thailand and Australia, with Indonesia topping the ranking at approximately USD 40 billion. Foreign entities participated in projects representing more than 90% of Indonesia’s announced investment value. This contrasts with India, where domestic companies dominate investment announcements.
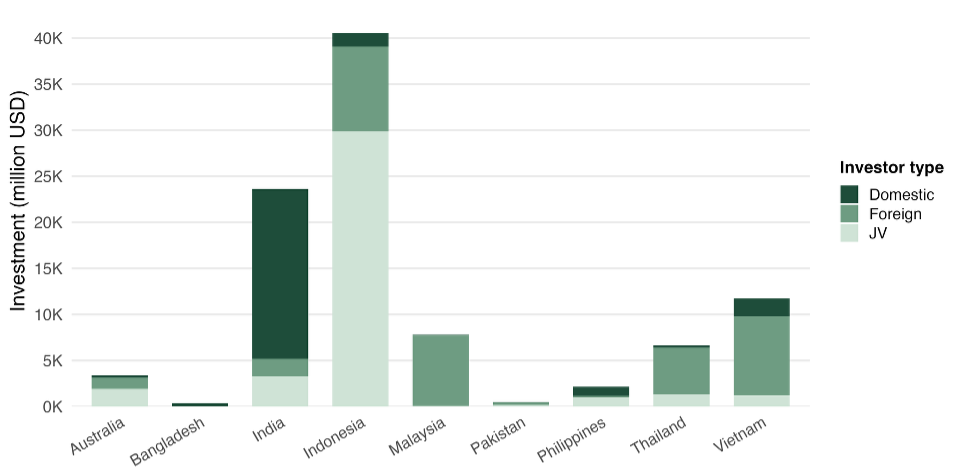
Green technology manufacturing investment announcements by economy and investor type, cumulative 2015–2026H1.
Green technology manufacturing investment announcements by economy and investor type, cumulative 2015–2026 H1. Source: Authors’ compilation using the University of Queensland Asia Cleantech Investment Tracker.

The figure below shows investment announcements in green technology manufacturing from 2015 to 2026 H1 across sectors in energy (batteries including minerals refining, electric solar PV and wind technology) and transport (electric vehicles) in 9 APAC economies. Investment announcements have accelerated particularly since 2021. In the first half of 2026, total investment announcements in green tech manufacturing reached almost USD 11 billion, led by Indonesia and India.
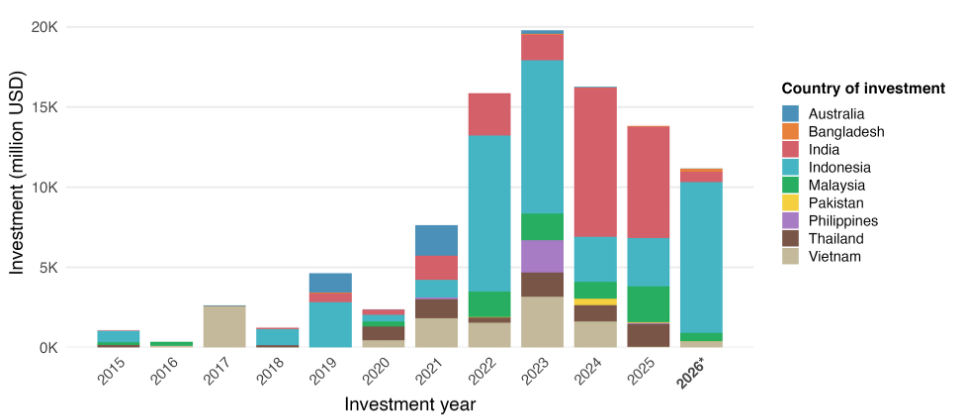
Green technology manufacturing investment announcements in select APAC economies, 2015-2026 H1.
Green technology manufacturing investment announcements in select APAC economies, 2015-2026 H1. Authors’ compilation using the University of Queensland Asia Cleantech Investment Tracker.

The figure below shows that investment announcements are particularly pronounced in the battery sector, with 2026 H1 showing exceptional growth driven by Indonesia. Similarly, investment in manufacturing related to solar PV is growing steadily across the region, with investments particularly in Indonesia and India. Meanwhile, investments related to the manufacturing of electric vehicles and wind are negligible over the past 18 months, whereas previously India and Indonesia saw significant investments.
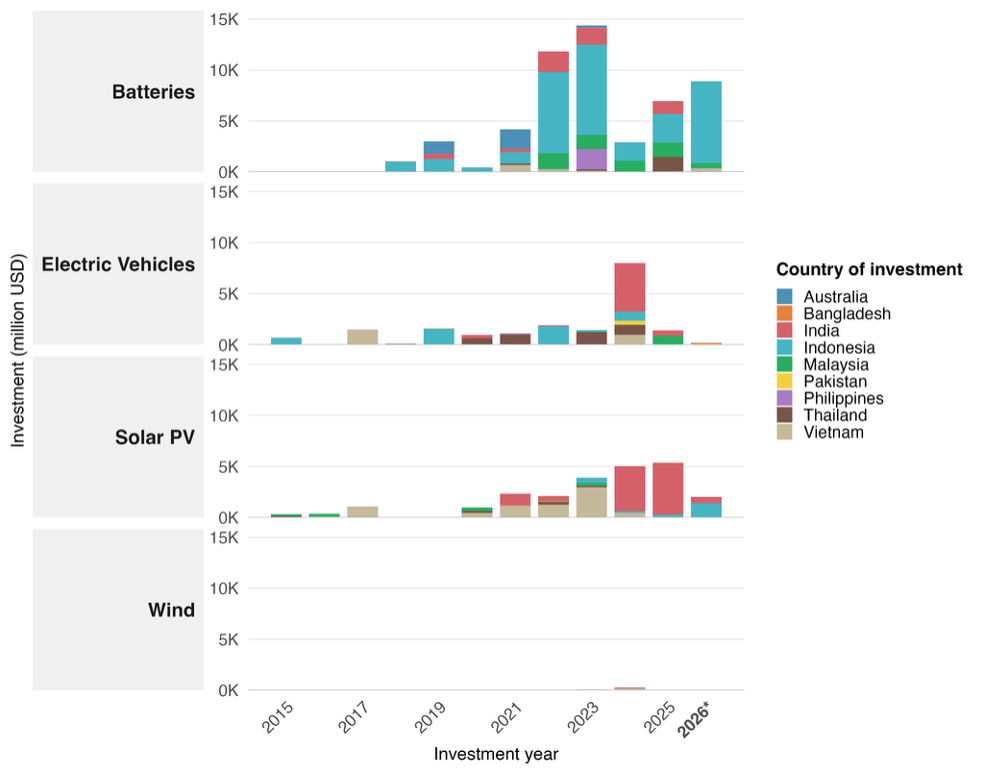
Green technology manufacturing investment announcements in select APAC economies, 2015-2026 H1
Green technology manufacturing investment announcements in select APAC economies, 2015-2026 H1. Source: Authors’ compilation using the University of Queensland Asia Cleantech Investment Tracker.

The figure below locates solar PV manufacturing announcements within the value chain. Most investment has occurred downstream, e.g., for final assembly of modules or packaging. This is consistent with trading patterns for countries in the region, where most traded value occurs in the downstream segments, e.g., importing cells and assembling into modules. More recently, upstream solar PV manufacturing investment announcements, including projects involving silicon and other processed inputs, have become more prominent in India.
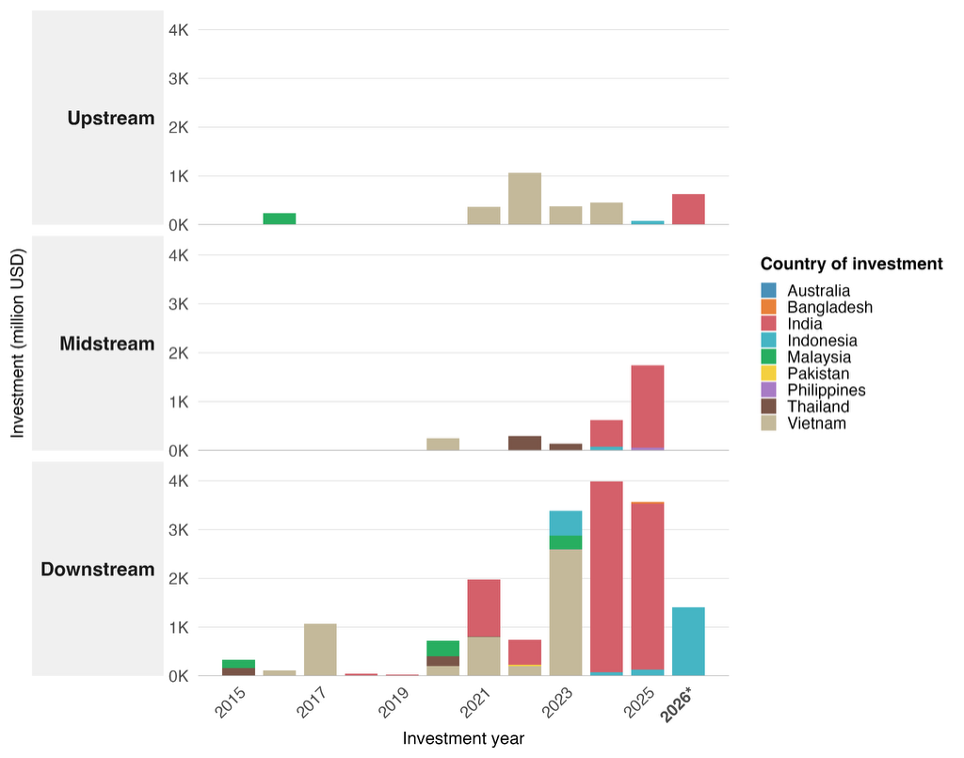
Solar PV manufacturing investment announcements by value chain stage, 2015-2026 H1.
Solar PV manufacturing investment announcements by value chain stage, 2015-2026 H1. Source: Authors’ compilation using the University of Queensland Asia Cleantech Investment Tracker.
Note: Upstream includes raw materials and processed inputs; midstream includes components used in subsequent manufacturing or assembly; downstream includes finished and market-ready products. Investment values are in USD million; undisclosed values are treated as zero. Data for 2026 cover January–June.

China’s Role in APAC Economies’ Green Technology Manufacturing Investment

Chinese companies are global leaders in green technologies in energy and mobility. The Figure below shows that Chinese companies also play a significant role in green technology manufacturing projects announced across APAC economies, although their participation varies considerably by destination. In Malaysia, 83% of all announced projects involved Chinese participation, compared with 60% in both Thailand and Indonesia. By contrast, Chinese participation was particularly limited in India (3%), despite its substantial number of domestic green technology manufacturing projects.

The share of Chinese companies varies across different green technologies. Chinese participation was highest in battery manufacturing (50%), followed by wind (40%), electric vehicles (35%) and solar PV (31%).
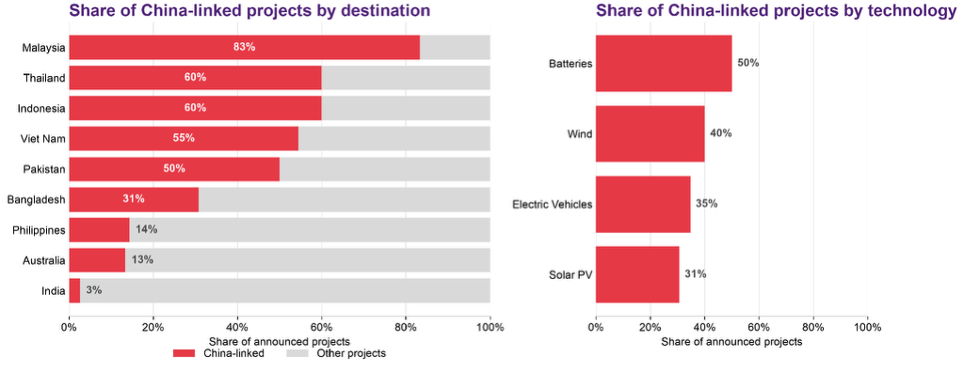
China’s role in green technology manufacturing investments in APAC economies, 2015-2026 H1
China’s role in green technology manufacturing investments in APAC economies, 2015-2026 H1.Source: Authors’ calculations using the University of Queensland Asia Cleantech Investment Tracker.

Pathways in APAC’s Green Economic Transition

Drawing on the preceding analyses of green technology utilization, trade, and manufacturing, Error! Reference source not found. maps APAC economies into five distinct green economy transition pathway categories.

  1. Import-dependent economies that utilize green imports to strengthen the green economic transition without relevant domestic green manufacturing
  2. Self-consumption economies that build green manufacturing capacity for domestic use
  3. Local value-adding economies that have significant green manufacturing capacity (mostly assembly) to add value to imported semi-finished products for export
  4. Comprehensive green economies that have built a strong green ecosystem that boasts green manufacturing capacity with strong domestic utilization and trade
  5. Low-intensity transition economies without significant focus on any green transition factor.

Import-Dependent Economies

Import-dependent economies have limited domestic clean energy manufacturing capacity and rely primarily on foreign suppliers for the technologies required for deployment. Australia, Pakistan and the Philippines have relied substantially on imported green technologies to support domestic deployment, while maintaining relatively limited domestic manufacturing capacity. In Australia, domestically manufactured solar panels accounted for only around 1% of installations in 2024, while 5.9 GW of new renewable generation capacity was added in 2025. Similarly, Pakistan imported approximately 16.6 GW of solar panels from China in 2024, supporting rapid solar deployment, particularly in behind-the-meter installations. The Philippines has also expanded its imports of renewable energy equipment, particularly solar technologies, alongside recent growth in renewable energy deployment. This pathway allows these countries, in principle, to benefit from declining green technology costs on international markets without bearing the costs of establishing a domestic manufacturing industry. Import dependence can thus represent a pathway of accelerating green technology deployment while not relying on domestic production capacity.

Self-Consumption Economies

India is an example of a self-consumption economy, combining large-scale domestic deployment with expanding manufacturing capacity and substantial imports of both intermediate and finished products. This structure enables domestic value addition while reducing, but not eliminating, dependence on imported finished technologies.

Local Value-Adding Economies

Local value-added economies are those that have developed domestic clean energy manufacturing capacity based on identifying export opportunities into international supply chains rather than driven by domestic utilization. These economies both import and export clean energy products and attract investment in manufacturing capacity but do not necessarily expand green technology utilization in these sectors.

Malaysia and Thailand exhibit more export-oriented manufacturing profiles alongside comparatively lower domestic deployment. Indonesia has attracted substantial announced manufacturing investment, particularly in batteries. However, its domestic deployment and clean-technology trade remain less developed than its investment pipeline. Indonesia therefore shows emerging characteristics of a local value-adding economy.

Comprehensive Green Economies

Viet Nam is an example of a comprehensive green economy in the APAC economies, owing to green energy and green mobility build-out, high levels of manufacturing investment, and significant trade volumes (particularly as a percentage of total traded goods). Viet Nam has developed green technology manufacturing capacity while becoming integrated into international trade networks for green technologies. Its manufacturing sectors can rely on imported intermediate and upstream inputs while producing goods for foreign markets.

Low-Intensity Transition Economies

Bangladesh can be classified as a low-intensity transition economy, characterized by limited domestic clean technology manufacturing and relatively modest levels of deployment, but with growing reliance on imported clean technology products. It has not experienced a large take-off in imports and utilization of green technologies. Increasing imports provide a potential channel through which deployment can expand relatively quickly in certain sectors.
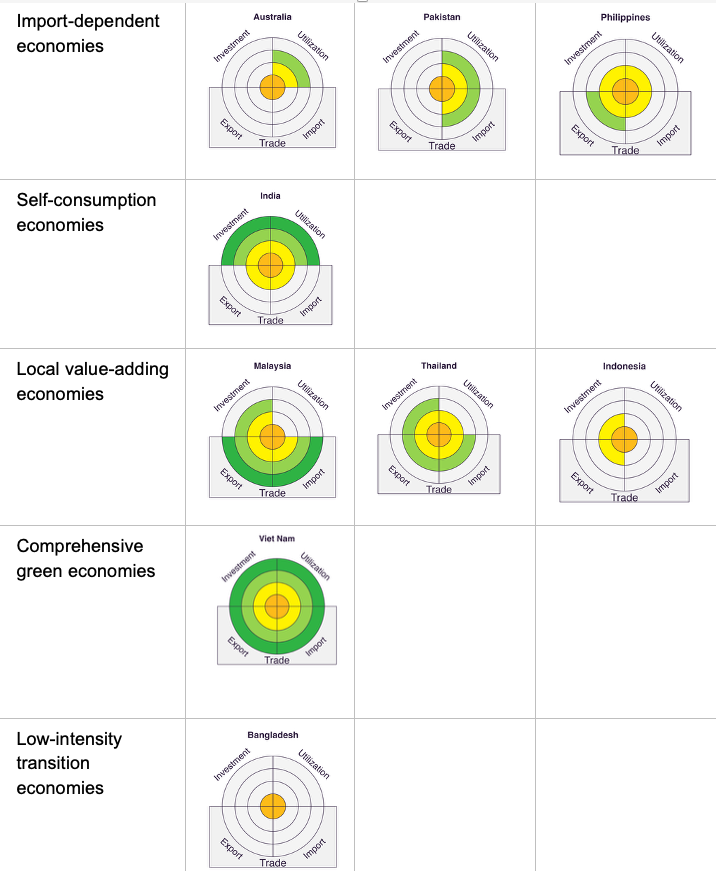
Green economy pathways to date of select APAC economies in solar and wind sectors.
Sources: Authors’ calculations using CEPII-BACI for trade, the University of Queensland Asia Cleantech Investment Tracker for manufacturing investment, Ember’s Yearly Electricity Data for capacity additions, and World Bank World Development Indicators for GDP.
Note: Manufacturing investment, utilization, imports and exports are normalized by average GDP over 2015–2025. Positive values are assigned to quartiles within the nine-economy sample: four rings indicate the highest quartile and one ring the lowest. A score of zero indicates no identified activity or reported value.

Recommendations and Conclusion

The green economic transition is underway across Asia-Pacific economies but with significant differences in the pathways and pace. For example, India, Viet Nam and the Philippines have both combined relatively strong renewable energy deployment with growing manufacturing activity, although India’s manufacturing is more domestically oriented, while Viet Nam has developed broader participation in international green technology value chains. Malaysia and Thailand have developed more export-oriented manufacturing profiles, while Australia and Pakistan have expanded renewable capacity primarily through imports. Bangladesh shows relatively low activity across deployment, trade and manufacturing indicators. Indonesia presents a different profile: domestic deployment remains relatively low and its trade position is mixed, but it has attracted exceptionally large manufacturing investment announcements, particularly in batteries. This places Indonesia within the local value-adding pathway, although announced investment has yet to translate fully into operational manufacturing capacity and domestic value creation.

Table 1 summarizes the green economic transition pathways based on the identified data and highlights the key opportunities and risks associated with each transition type. For example, import-dependent economies, such as Australia, Pakistan and the Philippines, can benefit from access to affordable imported technologies to accelerate deployment, but face risks associated with supplier concentration. Accordingly, these economies should diversify their sources of supply while exploring value-chain opportunities in niche sectors, such as green technology recycling.

Table 1: Green Economic Transition Pathways in APAC.

Transition pathwayIndicative economiesCore opportunityKey riskAction focus
Import-
dependent
Australia, Pakistan, the Philippines

Rapid deployment through access to competitively priced imported technologiesSupplier concentration, external supply disruptions and exposure to trade restrictionsDiversify import sources, strengthen supply-chain resilience and develop competitive niches such as recycling and maintenance
Self-consumptionIndiaDomestic demand supports industrial scaleCost premiums, protectionism and technology gapsLink manufacturing support to credible deployment, quality standards and grid readiness
Local value-addingMalaysia, Thailand, IndonesiaTrade links and existing manufacturing ecosystemsLimited domestic value added, weak demand and exposure to trade barriersMove selectively upstream, expand domestic deployment and strengthen skills, suppliers and innovation
Comprehensive green economyViet NamBroad value-chain participation supported by domestic demand and tradeRapid technology cycles can erode competitiveness without continuous upgradingSupport an innovation ecosystem and maintain credible domestic and export demand
Low-intensity transitionBangladeshBuild deployment and industrial capability from a low baseFossil lock-in, financing constraints and weak investment conditionsPrioritize grid-ready deployment, enabling regulation and realistic industrial niches

The findings point to four practical recommendations.

  • Improve understanding of value chain dependency and opportunities at the technology level. Governments should understand import concentration and opportunities for specific products such as solar modules, cells, inverters, battery cells, battery packs, EV components and grid equipment. Risk assessments should distinguish between products that can be sourced readily from alternative suppliers and those for which a single country or supplier dominates global manufacturing capacity.
  • Avoid treating a positive trade balance as proof of domestic capability. Net exports can reflect re-exporting, final assembly or foreign-owned export-platform production, which may or may not generate local value. Malaysia and Thailand’s export-oriented profiles should be assessed on their value additions in supply-chain stage, local employment, domestic suppliers and the operating status of manufacturing facilities. They are also often exposed to export fluctuations, including evolving trade barriers.
  • Use import diversification selectively, balancing with utilization speed. For all countries, a priority is to preserve access to affordable green technologies while reducing single-supplier exposure.
  • Understand local manufacturing capacity and value chain integration. While governments might be tempted to strengthen local manufacturing capability in green technologies, global value chains are highly competitive, with often decreasing unit costs, established logistics and fast-advancing technology. An investment in local manufacturing without sufficient integration in supply chains, innovation cycles and competitive pricing is rapidly lacking competitiveness.

A consistent finding is the central role of Chinese supply. China was the dominant source of imported low-carbon technology products for most economies covered, including in solar equipment, where Pakistan sourced 99% of measured imports from China in 2025. China is also the main source of APAC green technology manufacturing investment, particularly in batteries.

Annex: Methodology

  1. Green energy utilization data: The report uses data from Ember’s Yearly Electricity Data, which provides electricity generation and capacity data per country-year-electricity source. We calculated capacity additions manually by subtracting the annual reported total capacity per electricity source from the previous year, and performed consistency checks using secondary sources.
  2. Trade data: Bilateral trade data for 2002–2024 are obtained from BACI. For 2025, bilateral trade flows are constructed by combining each country’s reported trade data from UN Comtrade with China’s trade flows from the General Administration of Customs of China (GACC), harmonizing the resulting flows to match BACI terminology. We reconcile the two reports for each bilateral flow by estimating each country’s reporting reliability from the 2025 data and combining the reported values using reliability-based weights. Freight rates are estimated separately using a gravity equation and used to adjust the raw trade data. To maintain product-level granularity across five HS revisions, we map trade flows from earlier HS vintages to the latest HS revision using the composition of trade in the first year of each new HS revision to construct allocation weights for the corresponding product categories. We develop a new classification of low-carbon technology (LCT) products by cross-referencing multiple existing classification frameworks and manually assigning product codes to three stages of the value chain: upstream, comprising raw materials and other inputs; midstream, comprising intermediate goods and components; and downstream, comprising finished products.
  3. Cleantech manufacturing investment data: The report uses a project-level dataset developed by the University of Queensland covering solar PV, wind, electric vehicles and battery investments across selected Asian economies and Australia. The dataset includes information on location, technology and value-chain segment, companies and investor origin, investment timing, value, and manufacturing capacity. Projects were identified through systematic country-, technology- and value-chain-specific searches using government, company, industry and reputable media sources. The dataset was also cross-checked against the Rhodium Group Clean Investment Monitor (CIM) and public analyses based on Financial Times fDi Markets to improve coverage and consistency. Reported investment values are used where available; missing values are estimated using project comparables and capacity-based benchmarks.
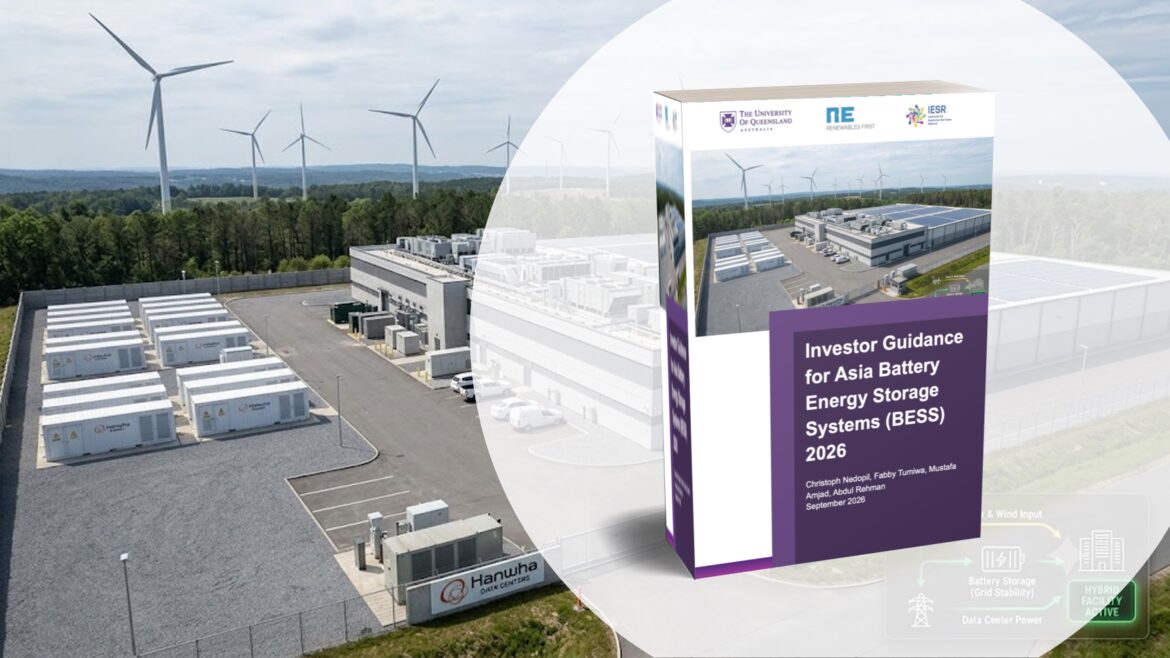
In this in-depth report, we analyze the 2026 investment landscape of Asia’s battery energy storage system (BESS).

  • Understanding BESS business models – from front-of-the-meter (FTM) to behind-the-meter (BTM), hybrid systems and different merchant and non-merchant revenue streams
  • Understanding the evolving landscape of BESS – with rapidly reducing cost
  • Financing instruments for BESS – from high-risk countries to more established countries
  • An in-depth analysis of BESS opportunities in 11 Asia-Pacific economies (Australia, Bangladesh, China, India, Indonesia, Lao PDR, Malaysia, Pakistan, The Philippines, South Korea, Thailand, Taiwan, and Viet Nam) including policy environment for FTM, BTM, electricity prices and market structures, and policy ambitions.

Executive Summary

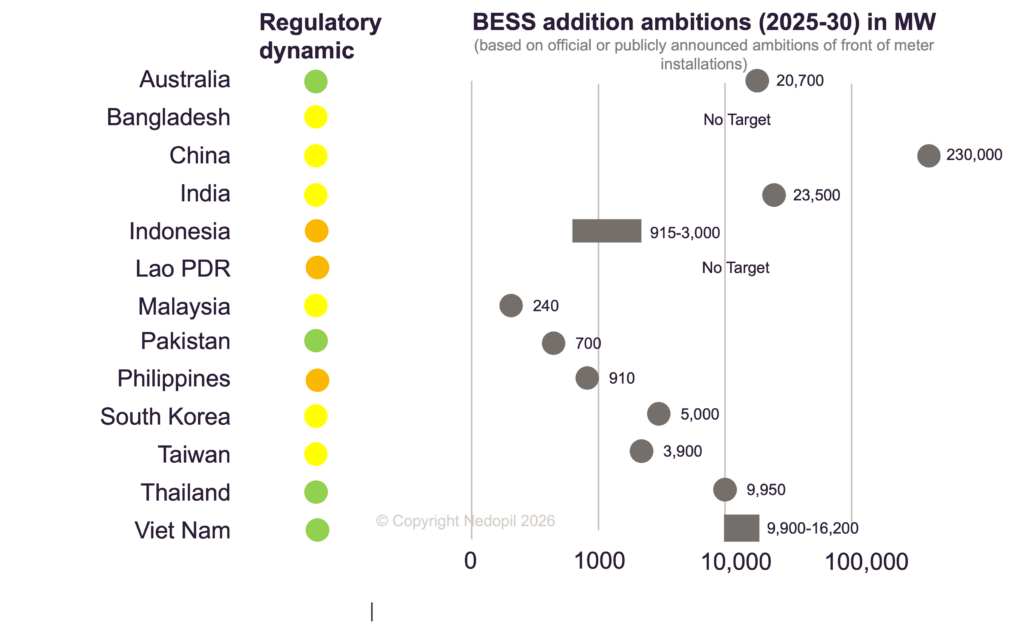
Battery energy storage systems (BESS) are becoming a core part of Asia’s power-sector transition. Growing solar and wind capacity is increasing demand for flexible capacity, frequency control and reliable supply, while battery costs continue to fall. The report estimates around 100 GW of BESS deployment across Asia-Pacific by 2030, in addition to around 160 GW in China. Yet, policy ambitions vary widely across the observed countries

BESS Battery Asia Policy Ambitions gigawatt, Australia, China, Pakistan, philippines, Malaysia, South Korea, Japan, Taiwan, Vietnam, Thailand, Pakista
BESS Battery Asia Policy Ambitions gigawatt

For investors, the opportunity is highly market-specific. Project returns depend on the services a battery can provide, the rules and tariffs that pay for those services, the ability to combine revenue streams, grid-connection costs, counterparty quality and the availability of suitable finance. A low-cost battery does not compensate for weak tariff design, unavailable market access or an unbankable revenue profile.

Report scope and audience

The Investor Guidance for Asia Battery Energy Storage Systems (BESS) 2026 is based on a regional survey, expert interviews and desk research undertaken from February to July 2026. It is written for infrastructure and institutional investors, banks, developers, utilities, strategic investors, corporate energy users and policymakers. It assesses business models, market rules, technology and sizing, siting and finance across Australia, Bangladesh, China, India, Indonesia, Lao PDR, Malaysia, Pakistan, the Philippines, South Korea, Taiwan, Thailand and Viet Nam, and includes project cases in Pakistan and Indonesia.

What investors need to test

A BESS project needs a defined system or customer value proposition and a credible path to monetize it. The main value pools are:

  • Energy arbitrage: charge at low prices and discharge at high prices.
  • Ancillary services: frequency response, voltage control, reserves and black-start capability.
  • Capacity and availability payments: contracted revenue for reliable capacity.
  • Renewable firming: store curtailed or clipped solar and wind output and deliver a more predictable product.
  • Cost avoidance/investment deferral: defer grid upgrades or relieve congestion at substations and load centres.
  • For industrial and private consumers, reduce demand charges, shift load across time-of-use tariffs, increase solar self-consumption and avoid diesel use or outage costs.

Before committing capital, investors should establish the position in the local policy environment:

  • Is storage legally recognized and licensed as a distinct asset class.
  • Can assets operate fully to charge, discharge and participate in energy, ancillary-service, reserve or capacity markets.
  • Is revenue stacking permitted and operationally feasible through metering, dispatch and settlement rules.
  • Do network fees apply on charging, discharging or both, and whether these charges undermine arbitrage margins.
  • What is the creditworthiness of the utility, offtaker, optimizer and EPC/O&M counterparties.

Revenue stacking is a material. Batteries that can combine energy trading, ancillary services, capacity value and local network support have a more diversified revenue base. The report identifies major constraints on stacking in the Philippines, Taiwan, Malaysia, South Korea and Thailand. In these markets, projects may need a tolling arrangement, availability payment, firm offtake agreement, subsidy or concessional capital.

Front-of-the-meter/behind the meter: where to invest in Asia

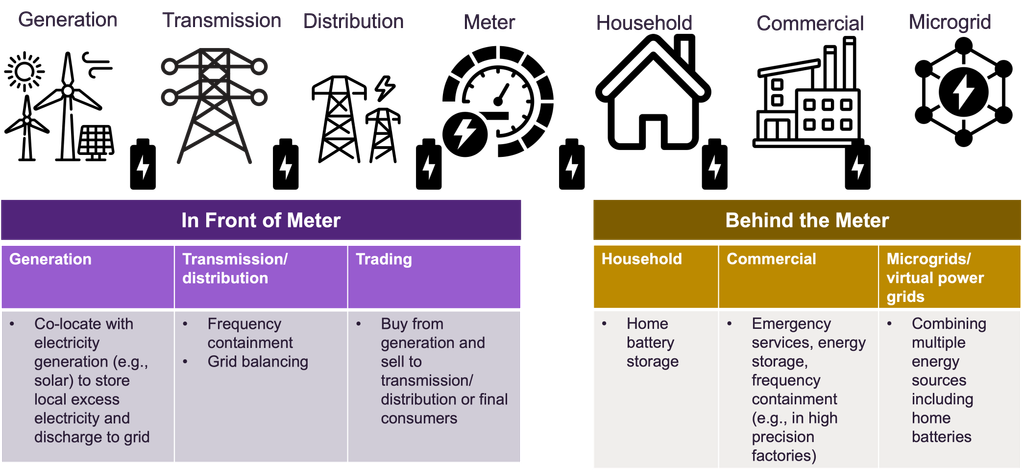
Front-of-the-meter (FTM) storage includes standalone utility-scale BESS, renewable-plus-storage projects and batteries providing transmission or distribution support. Its strongest economics are found where price volatility, ancillary-service remuneration, storage market access and grid connection align.

EconomyInvestor readingMain FTM opportunitiesMain constraints or risks
AustraliaThe most developed multi-revenue market in the surveyReported summer spread of about USD 200/MWh; arbitrage, ancillary and reserve services, capacity mechanisms, hybrid projects, virtual power plants and revenue stackingMerchant revenues and ancillary-service prices can decline as capacity grows; connection and congestion risks still require site-level analysis
Bangladesh and Lao PDREarly-stage markets for public or contracted deploymentHybrid systems, utility-led procurement and grid-support applicationsLong-term-contract structures and weak market pricing limit merchant arbitrage
ChinaLarge-scale opportunity with substantial policy and market depthHybrid and standalone storage, capacity and ancillary services, revenue stacking; reported daily spread about USD 110/MWhMarket rules and price formation vary by province; investors require local market and offtake analysis
IndiaStrong growth market, especially for renewable firming and emerging trading opportunitiesReported daily spread about USD 100/MWh; ancillary and reserve services; virtual power plants; growing real-time tradingHybrid model and capacity-payment arrangements are not uniformly supported; state-level rules and off-taker risk matter
IndonesiaSelective opportunity rather than broad standalone-BESS marketHybrid systems, grid support and diesel-displacement applications, particularly remote systems and islandsLong-term contract structure limits arbitrage; standalone projects face constrained economics under current conditions
Malaysia, Taiwan, and ThailandFocus on defined utility, industrial or hybrid use cases rather than broad merchant strategiesSelected hybrid, ancillary or subsidized applicationsLimited support for storage trading, capacity mechanisms, virtual power plants and/or revenue stacking constrains standalone FTM cases
PakistanEmerging opportunity where hybridization can be more bankable than standalone merchant storageReported daily spread about USD 70/MWh in emerging wholesale market; hybrid projects and revenue stacking; developing bilateral marketStorage trading, capacity and ancillary frameworks remain limited; FX, off-taker and regulatory risks require risk mitigation
PhilippinesHigh potential but execution-intensiveReported daily spread about USD 170/MWh; arbitrage, ancillary services, reserves, renewable firming and island-grid applicationsRevenue stacking constraints identified in the regional assessment; double network fees (buying and selling), island logistics and implementation risk can weaken returns
South KoreaSelective, contract-led marketHybrid storage and some policy-supported deploymentReported daily spread around USD 10/MWh; limited support for several BESS business models and revenue stacking
Viet NamPolicy momentum and renewable-integration need, but limited merchant caseHybrid storage, renewable firming, ancillary and reserve functions; mandated storage requirements for some renewable projectsMinimal reported arbitrage spread; single-buyer characteristics and incomplete stacking rules favour contracted rather than merchant models

For investors, this analysis has the following implications

  • Easy picking in multi-revenue markets: Australia, China and selected parts of India offer the broadest combination of price spreads, permitted business models and potential for stacking.
  • Use contracted structures in regulated markets: Viet Nam, Indonesia, Bangladesh, Lao PDR, Taiwan, Malaysia and Thailand are more suitable for utility procurement, renewable firming, tolling or public-supported projects than pure merchant arbitrage.
  • Treat the Philippines and Pakistan as high-upside, higher-structuring markets: value can be substantial, but returns depend on regulatory implementation, network charges, counterparty protections and finance.
  • Co-location can reduce development cost: sharing land, substations, transformers and connection rights with renewable generation can reduce CAPEX and capture curtailed output.
  • Demand-side locations can offer higher value: batteries near congested cities, industrial zones and substations may access peak prices, local network-support contracts and grid-deferral value, although land, permitting and connection costs are often higher.

Behind-the-meter: customer-led returns

Behind-the-meter (BTM) storage serves industrial, commercial and residential customers, often combined with rooftop solar, backup generation or both. It can be more viable than FTM storage where wholesale markets are limited because returns arise from avoided customer costs.

Economy or market groupInvestor readingBTM value drivers
AustraliaStrong residential, commercial and industrial market with enabling tariffs and aggregation potentialTime-of-use optimization, demand-charge reduction, solar self-consumption, virtual power plants and reliability
ChinaLarge commercial and industrial opportunity where tariffs and demand profiles support storageHigh electricity-cost exposure, time-of-use optimization, peak shaving and onsite renewable integration
IndiaAttractive C&I opportunity in locations with demand charges and high peak-cost exposurePeak shaving, demand-charge avoidance, onsite solar and reliability for energy-intensive users
PhilippinesHigh retail prices and reliability needs strengthen C&I and island-system casesLoad shifting, backup power, diesel displacement, solar integration and avoided outage costs
PakistanHigh tariffs support customer-side storage, especially where reliability and self-generation matterTime-of-use savings, solar-plus-storage, generator displacement and resilience
TaiwanIndustrial peak and voltage penalties can support targeted BTM deploymentPeak shaving, power-quality management and demand-charge reduction
IndonesiaBest opportunities are remote, island and diesel-hybrid settingsFuel savings, generator optimization, microgrids, renewable integration and avoided fuel logistics
Viet Nam, Malaysia, Thailand and South KoreaTargeted C&I opportunities, conditional on tariff design, customer load profile and local installation rulesTime-of-use shifting, rooftop-solar self-consumption, peak control and resilience

These results have the following investment implications:

  1. Focus on customers with high demand charges, large time-of-use spreads, expensive diesel generation or material outage costs.
  2. Underwrite savings from actual interval load data and tariff bills, rather than average national electricity prices.
  3. Assess four customer value streams: demand-charge savings, energy shifting, solar self-consumption, and reliability or avoided-outage value.
  4. Use smart contracts like energy-as-a-service, leasing, shared-savings contracts, solar-plus-storage PPAs or battery-as-a-service to reduce customer upfront CAPEX.

Financing and risk allocation

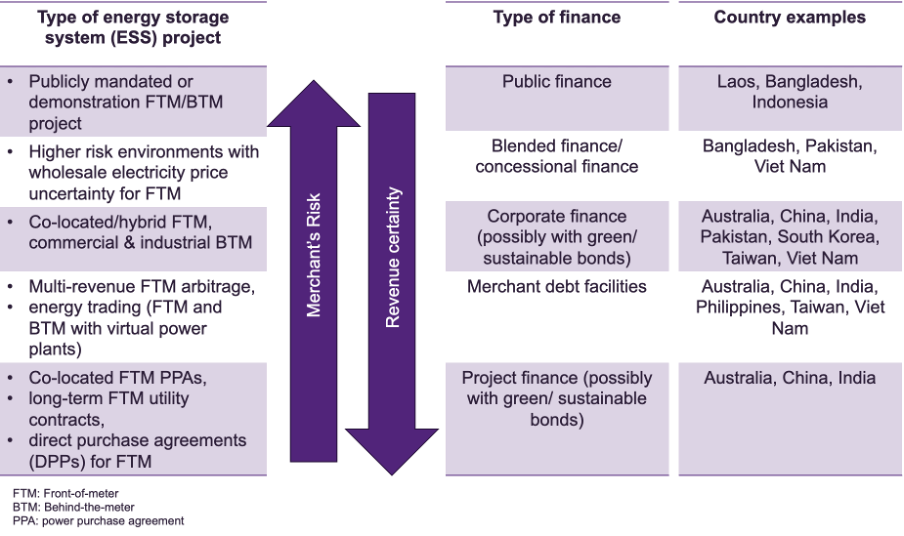
The capital structure should match the reliability of project revenues.

  • Traditional project finance: appropriate for assets supported by long-term utility tolling, capacity contracts, firm PPAs or energy-service agreements with creditworthy counterparties. Such projects can support roughly 60–80% debt, subject to strong EPC, O&M, warranty, insurance, reserve-account and debt-service protections.
  • Merchant debt: suited to mature and liquid markets with high price volatility and capable optimizers. Expect shorter tenors, lower leverage—typically around 40–50%—high debt-service coverage requirements, cash sweeps and refinancing risk.
  • Corporate finance: useful for utilities, developers, industrial groups and large customers in earlier-stage markets. Corporate balance sheets can absorb merchant volatility and fund strategic projects that are not yet suitable for non-recourse debt.
  • Green and sustainability-linked bonds: most suitable for large, creditworthy sponsors or aggregated BESS portfolios rather than small standalone projects.
  • Blended and public finance: relevant where FX exposure, utility credit risk, uncertain regulation or weak market mechanisms prevent commercial financial close. Concessional debt, first-loss capital, guarantees, technical-assistance grants, local-currency finance and political-risk cover can make otherwise marginal projects financeable.
Financing models for Battery Energy Storage (BESS) from project finance to merchants dept
BESS financing models

Investors should contract or hedge the risks that cannot be borne efficiently in the equity case: offtake and utility payment risk, delay of engineering/ procurement/ construction (EPC), battery performance and degradation, optimization performance, FX exposure, curtailment, network charges and regulatory change.

About the report

This guidance document was written for the Green Energy Network – Asia (GEN-A), an initiative by The University of Queensland in Australia, in collaboration with the Institute of Essential Services Reform (IESR) in Indonesia, Pakistan China Institute (PCI) in Pakistan, Renewables First (RF) in Pakistan, Climate Smart Ventures (CSV) and the Green Finance & Development Center (GFDC) in P.R. China.

Key findings

  • 2026 H1 saw the highest BRI engagement for any first six months since 2013, with USD49.8 billion in investment and USD76.5 of construction contracts.
  • China’s energy related engagement in 2026 H1 reached record levels with about USD36.3 billion – almost double the energy engagement in any first half year since 2013 except 2025.
  • 56% of China’s energy engagement was green – a new record both in absolute and in relative terms
    • More than USD20 billion in H1 2026, same level as green energy engagement in all 2025;
    • More than 20 GW of green electricity projects confirmed through investment and construction – more than in all of 2025.
  • A Chinese company agreed to build a new 660 MW coal fired power plant in Zambia – approvals are pending.
  • Metals and mining sector reached a record high of USD 21.8 billion in 2026 H1 alone, higher than any full year since 2013 except 2025 – mostly in processing not mining.
  • Focus areas were steel production (Egypt) and aluminum (Kazakhstan), highly relevant for e.g., automotive manufacturing and transmission lines.
  • The technology and manufacturing sector reached record levels growing by about 11% (technology) and 81% (manufacturing) compared to 2025 H1 to USD17 billion and USD6.5 billion, respectively.
  • The transportation sector grew for the first time since 2020 to USD18.2 billion – all through construction contracts.
  • Africa – again – topped the regional rank of BRI engagement, almost tripling Chinese BRI investment compared to H1 2025 to USD33.5 billion – more than ever.
  • Middle East tops the list of construction engagement with USD 36.5 billion – record levels for any H1 since 2013.
  • No engagement in Pakistan or Russia recorded in H1 2026.
  • The private sector expanded its share of total engagement (USD) from 13% in 2020 to 48% in 2026 H1 (as compared to state-owned companies).
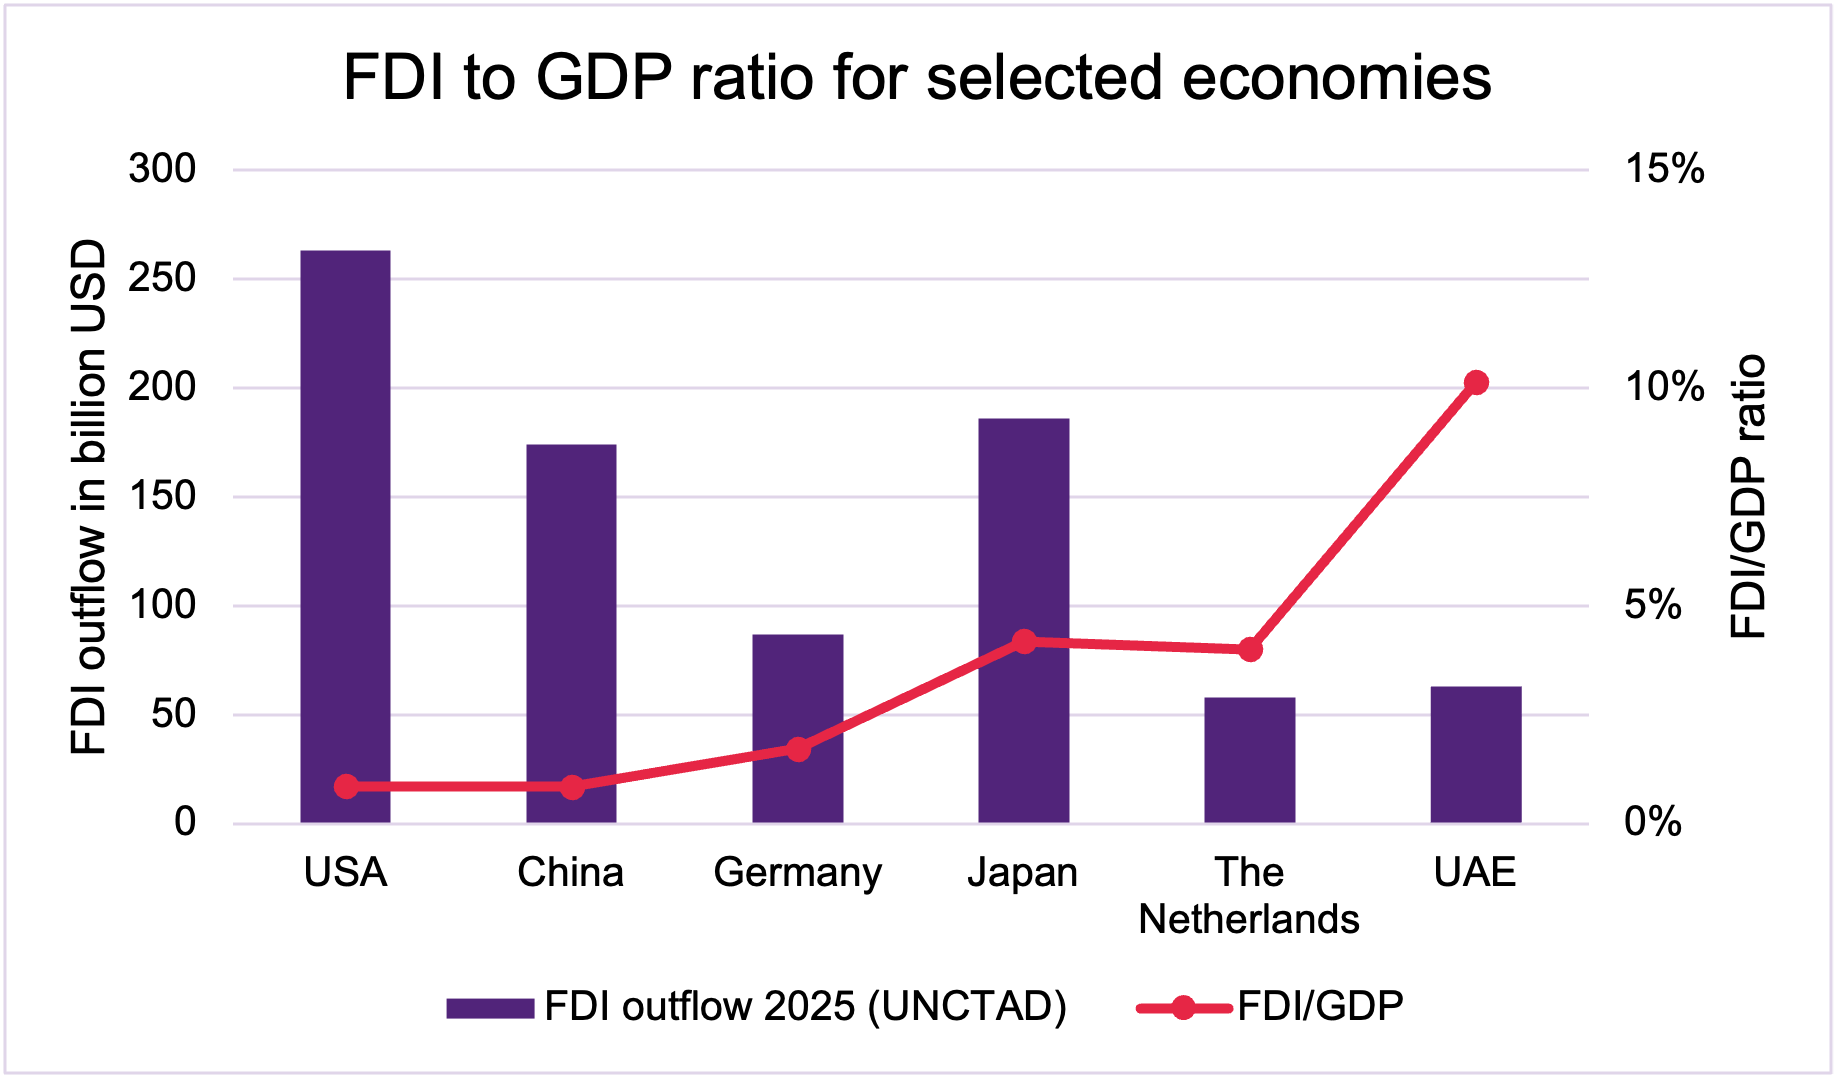
  • China’s global footprint in overseas investment remains small compared to its GDP (0.8%) – significantly smaller than Germany (1.7%), The Netherlands (4.0%), Japan (4.2%), or UAE (10.1%).
  • For the rest of 2026, I see continued opportunities for Chinese engagement in BRI countries with a continued focus on energy, mining and new technologies.
  • Both global trade frictions and fossil fuel price volatility can be an opportunity for Chinese BRI engagement such as green sectors and manufacturing localization.

Overview – record first half in total Belt and Road Initiative (BRI) engagement, but drop in investment

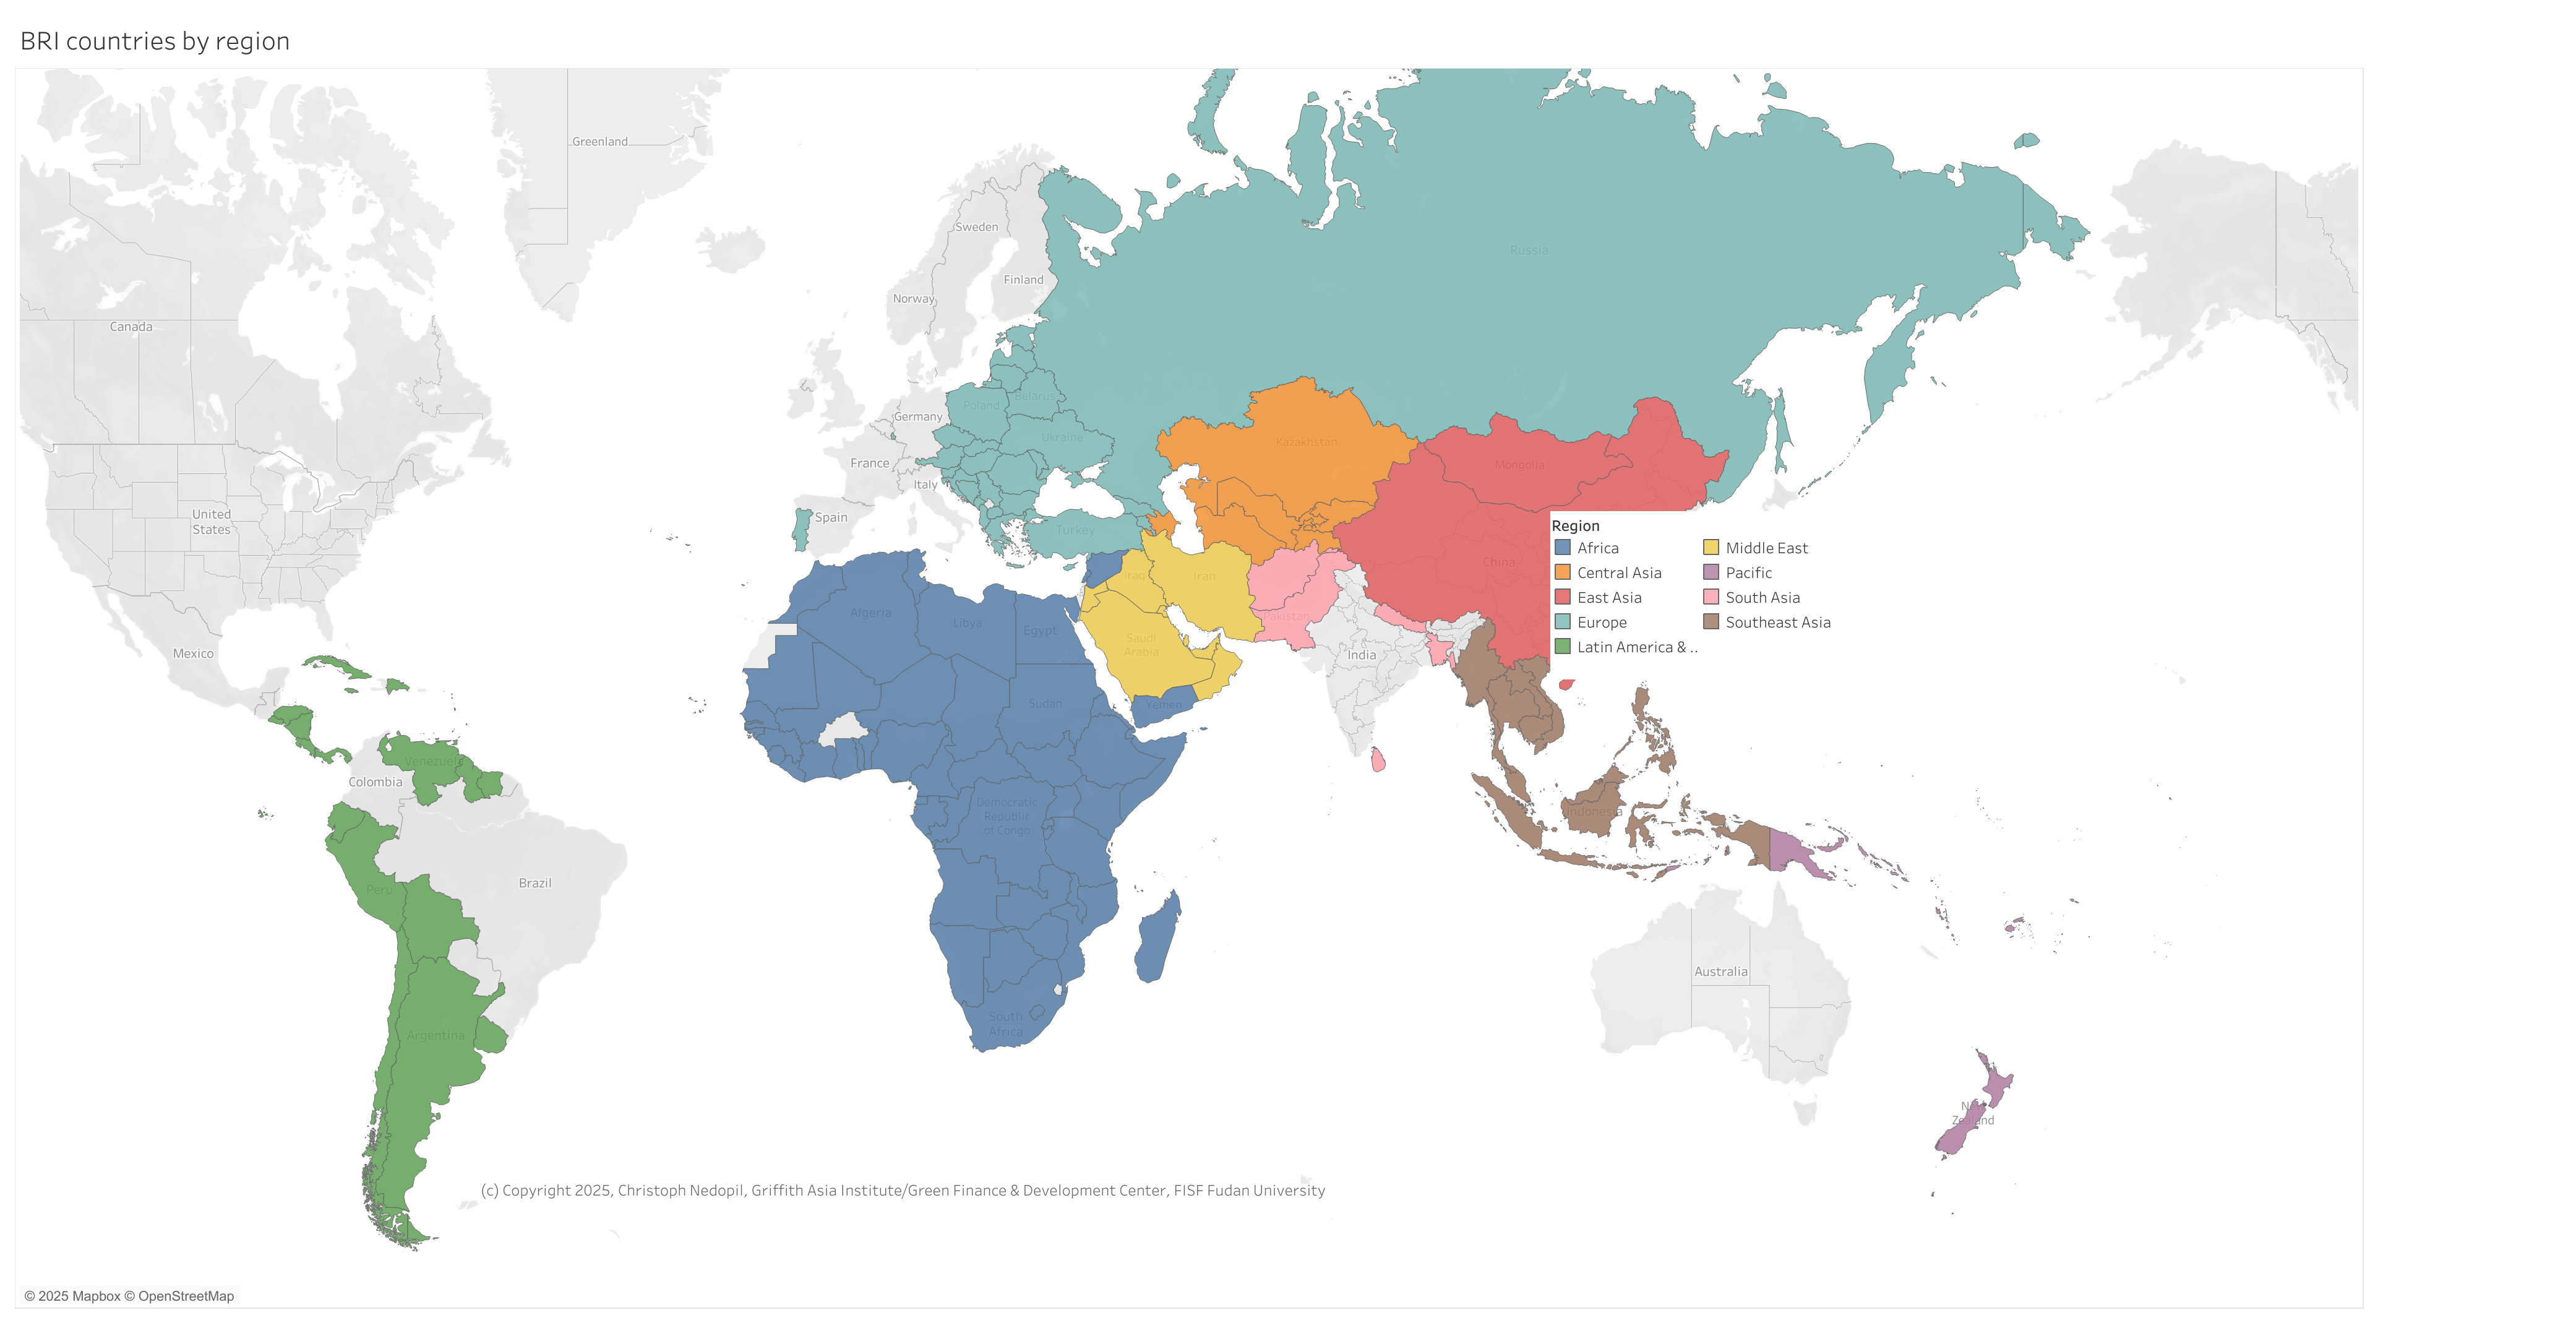
Preliminary data on Chinese engagement in the 150 countries of the Belt and Road Initiative1 through investments and construction contracts show combined record for any first half year:

  • USD 76.5 billion (+ USD 12.2 billion compared to 2025 H1) in construction contracts
  • USD 49.8 billion (- USD 6.2 billion compared to 2025 H1) in investment[1]

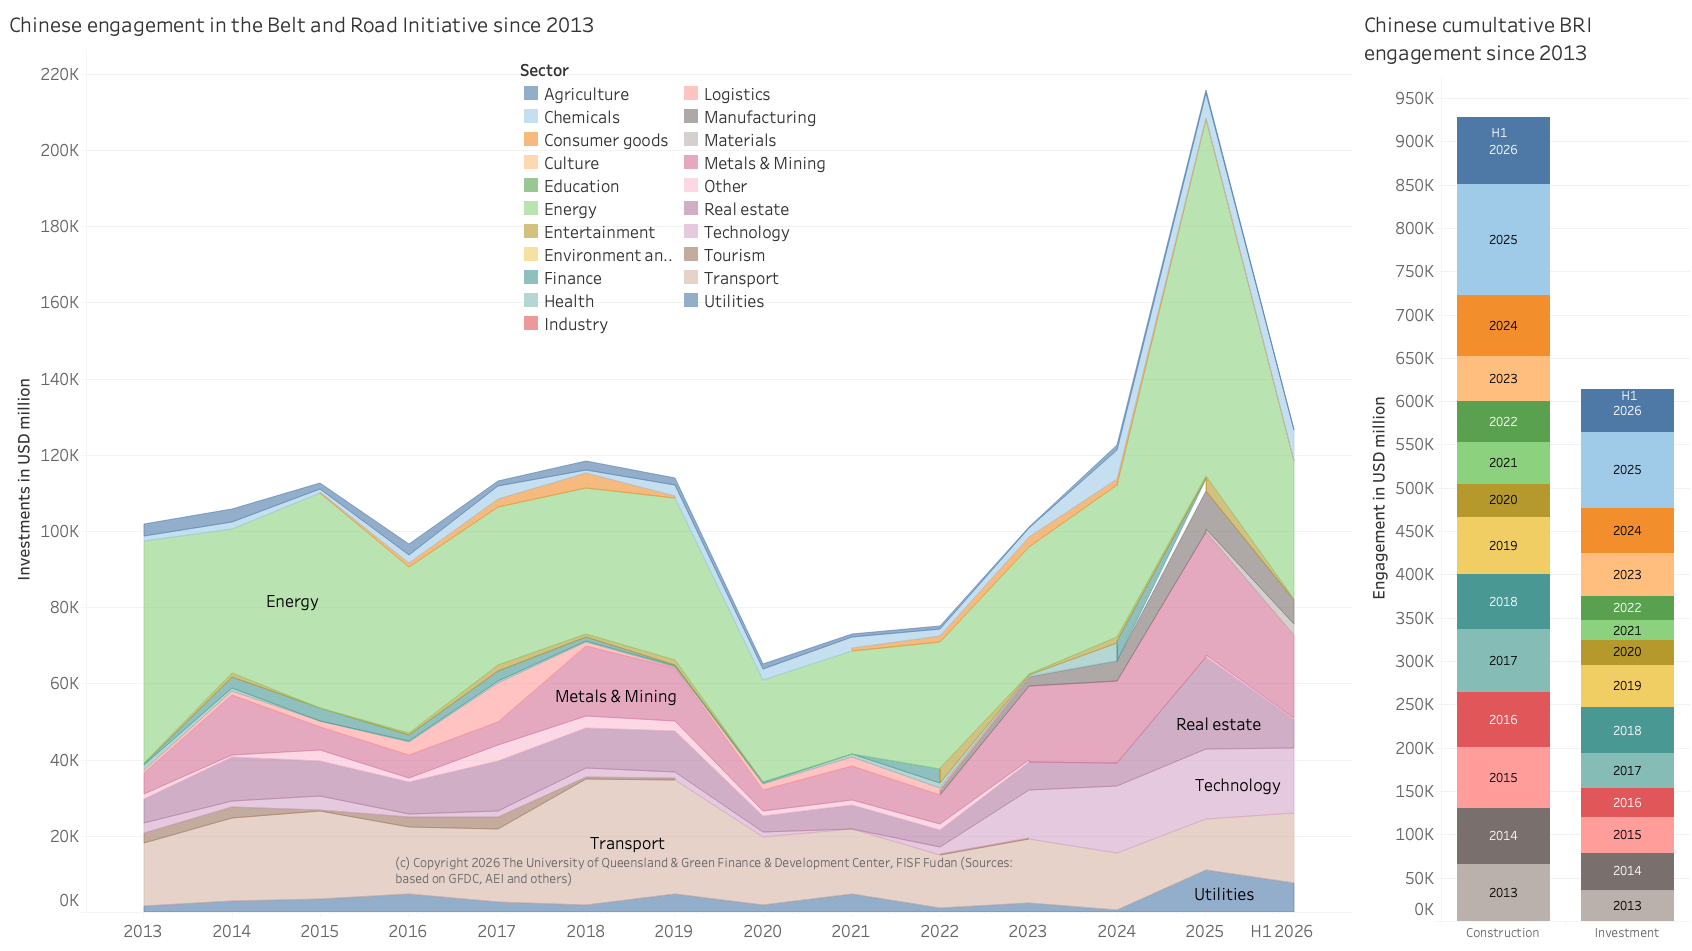
This equals to a total engagement of USD 126.4 billion through construction contracts and investments (see Figure 1) in about 186 deals in 2026 H1 (+2 in deal numbers compared to 2025 H1).

Cumulatively, Chinese BRI engagement has reached USD 1.539 trillion since 2013 of which USD 926 billion in construction and USD 614 billion in investments.

China's BRI engagement by sector from 2013 to 2026 H1 (left) and cumulative (right)
Figure 1 China’s BRI engagement by sector since 2013 (left) and cumulative (right)
About the data and methodology:
In June 2026, the Ministry of Commerce (MOFCOM) released new BRI engagement statistics covering the period of January to May 2026. According to these data, Chinese enterprises invested about USD 14.66 billion in non-financial direct investments in Belt and Road partner – a decrease of 5.7%). At the same time, the value of newly signed project contracts by Chinese enterprises in Belt and Road partner countries was USD 89.66 billion (an increase of 5.2%). While the MOFCOM data are relevant and confirm the trends, the granularity and definitions of BRI engagements are not transparent, including what counts as BRI countries.  

For this report, BRI engagements are defined as those Chinese construction and investment deals in countries that we have identified as having an active Memorandum of Understanding (MoU) with China to cooperate under the BRI at the time of the report. To stay consistent with data over time and avoid an inflation/deflation of the value of BRI engagement across time simply by adding/subtracting countries that enter or exit the BRI in each given year, the analysis counts Chinese engagement in current BRI members, no matter when they signed the MoU (thus, if the Syrian Republic signed a BRI MoU in 2022, the analysis counts Chinese engagement in Syria since the initiation of the BRI in 2013 as BRI engagement in Syria). A similar approach is used for countries that exited the BRI (i.e., if Italy exited the BRI in 2023, the analysis does not count any Chinese engagement in Italy to the BRI engagement for any year). The definition of BRI countries currently includes 150 countries that had signed a cooperation agreement with China to work under the framework of the Belt and Road Initiative (BRI) by December 2025.  

Our data since 2024 are collected based on a rigorous independent collection process: we include projects with validated credible sources or two independent sources. We include projects with a signed contract for implementation or clear announcements of investments (e.g., stock market announcements). We consistently aim to include projects worth about USD20 million. The data until 2023 was reliant on the China Global Investment Tracker (CGIT), published by the American Enterprise Institute, which only include deals larger than USD 100 million. We have significantly expanded the original CGIT data based on our research also for the years until 2023.   As with most data, they tend to be imperfect and need regular updating.

Share of construction in China’s BRI increases driven by high valued construction contracts

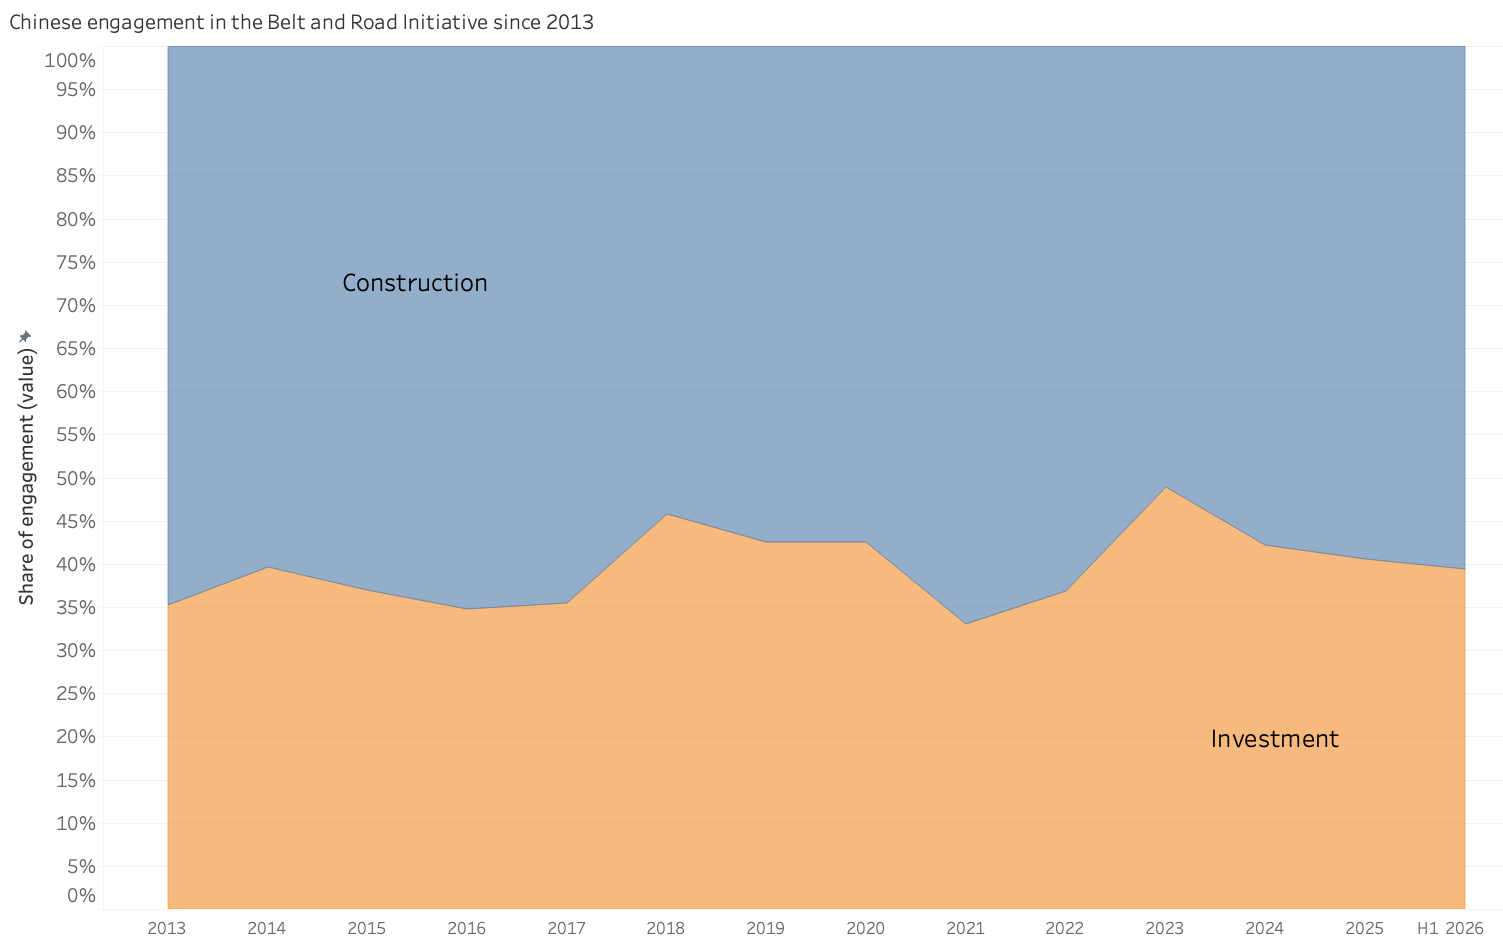
The share of Chinese engagement in the BRI through construction reached about 60.6% and increased compared to 2025 driven by high construction volume increases. This compares to about a share of 39.4% for investment of Chinese BRI engagement (see Figure 2).

Good to know:
Construction contracts used to be financed through loans provided by Chinese policy banks often utilizing host country guarantees. Recently, many construction projects were funded through syndicated loans with international partners, including multilateral development partners. One project example is a multitude of BESS projects built by Chinese contractors in Egypt, which are backed by up to USD223.5 million of senior debt financing from the European Bank for Reconstruction and Development (EBRD).
Share of construction and investment engagement in the BRI 2013 to 2026 H1
Figure 2: Share of construction and investment engagement in the BRI 2013 to 2026 H1

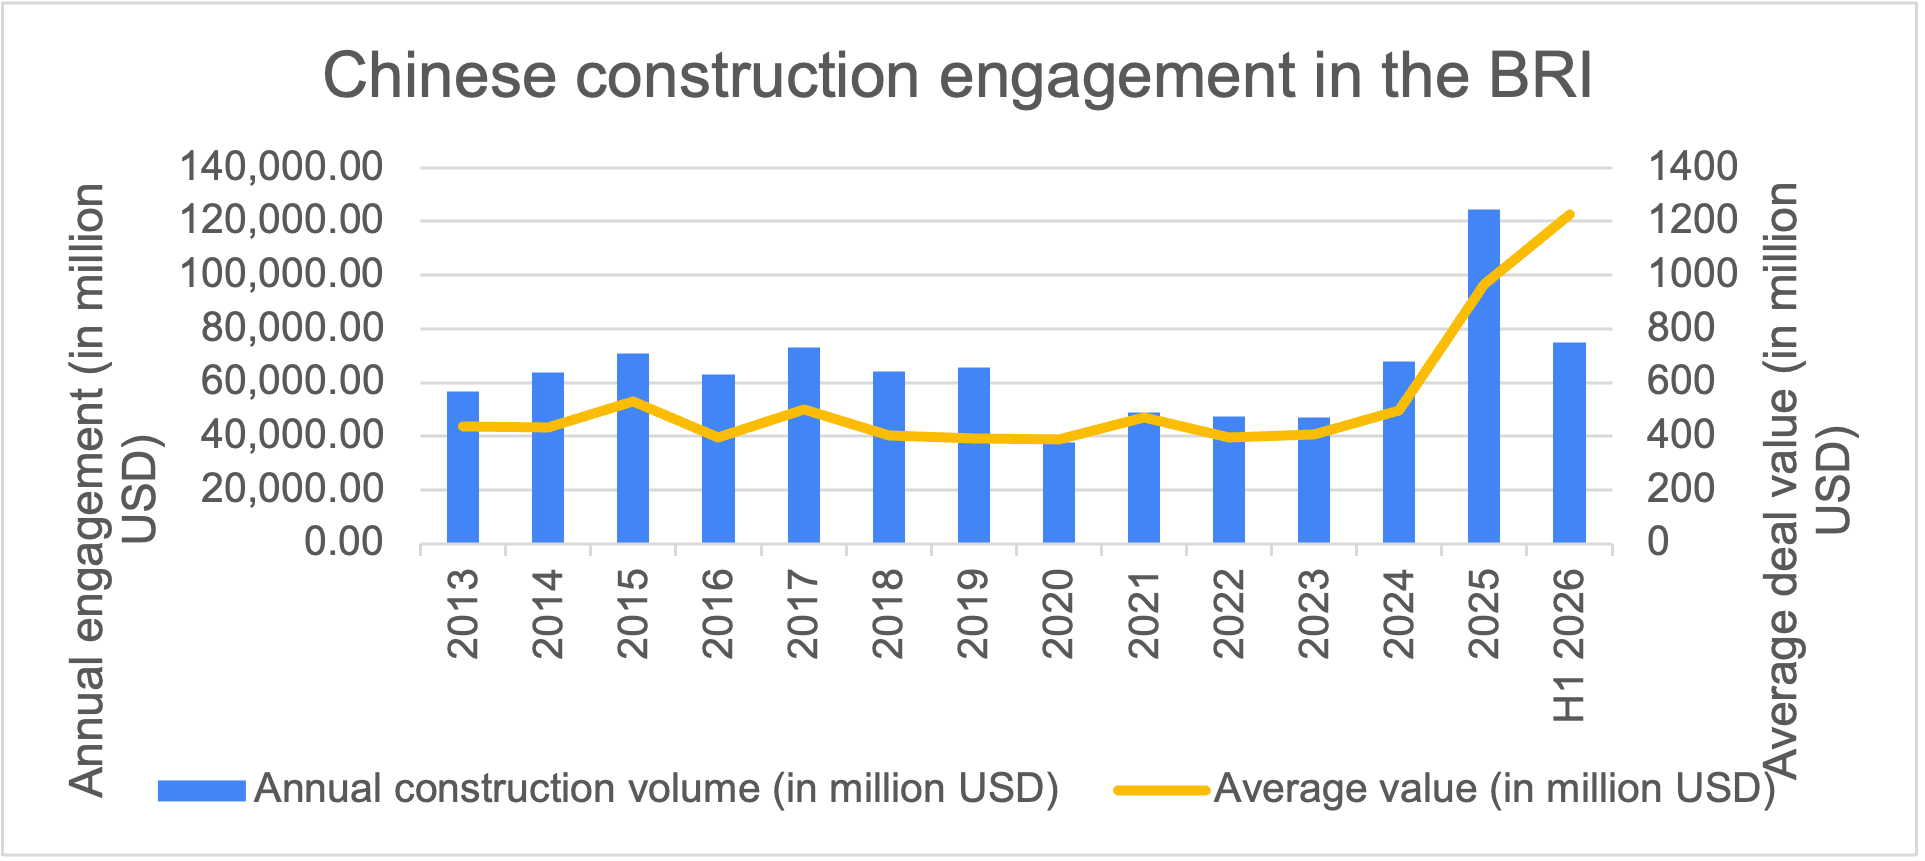
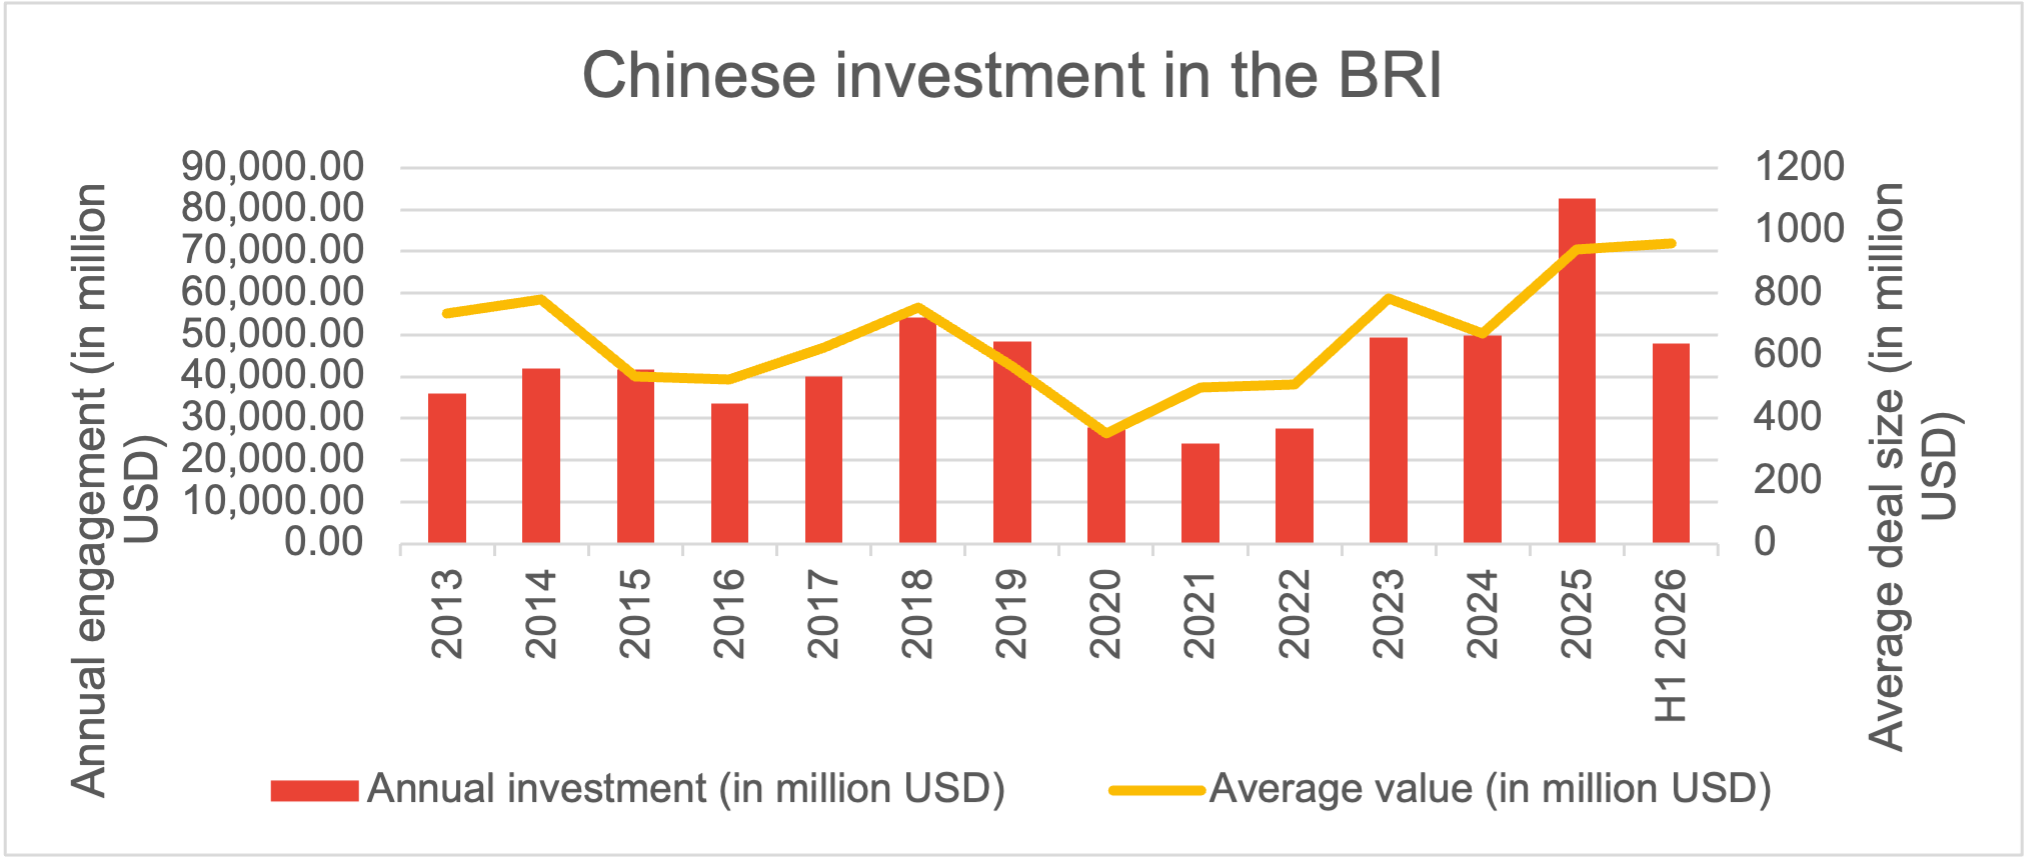
The average deal size for investments with a value larger than USD 100 million grew to record levels of USD 958 million in 2026 H1 (from USD 672 million in 2024)[2]. The value is about three times higher than in 2020 (during the first year of COVID).

For construction projects, the average deal size in 2026 H1 increased to USD 1.23 billion, up from USD 496 million in 2025 (see Figure 3).

Both developments are driven by 32 large projects with a volume of more than USD 1 billion (up from 29 such projects in the first half of 2025), such as a USD 8 billion rail construction project in UAE, or a USD 10 billion investment project in Egypt’s steel sector.

Similar to last year, this leads to the conclusion that the “small yet beautiful projects” (小而美)propagated through official channels during COVID should be seen as bygone.

Deal size of Chinese engagement in the BRI of deals larger than USD100 million 2013- 2026 H1: top, for construction projects; bottom investments
Figure 3 Deal size of Chinese engagement in the BRI of deals larger than USD100 million 2013- 2026 H1: top, for construction projects; bottom investments

Regional analysis of Chinese BRI engagement

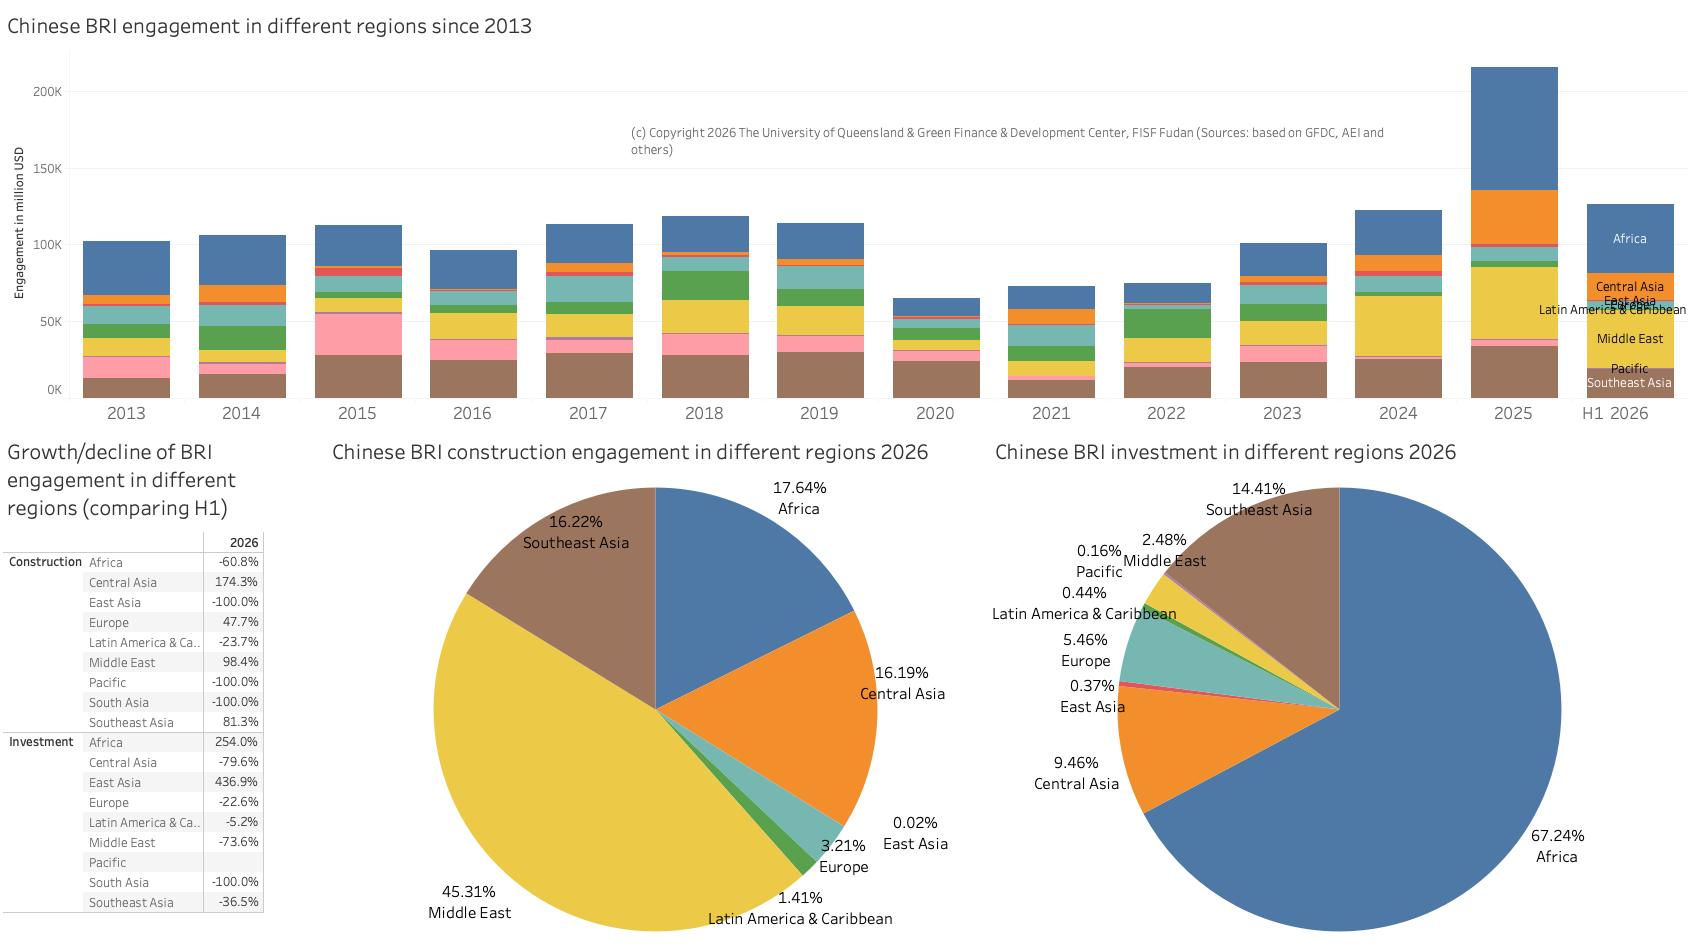
African BRI countries are top destination for Chinese BRI engagement, almost tripling Chinese BRI investment announcements compared to H1 2025.

East Asia investment announcements more than quadrupleswhile construction engagement vanishes.

Middle East tops the list of construction engagement with USD 36.5 billion – record levels for any H1 since 2013.

Chinese regional BRI engagement was not evenly distributed among all regions[3]  (see Figure 4). China’s regional construction engagement across multiple regions increased significantly compared to H1 2025

  • Central Asia: plus 174% to USD 13.2 billion
  • Middle East: plus 98.4% to USD 36.5 billion
  • Southeast Asia: plus 81.3% to USD 12.3 billion

This compares to various regions that saw no Chinese construction engagement in H1 2026, including in the Pacific, East Asia, South Asia.

Looking at Chinese regional BRI investment, only two regions saw significant growth

  • East Asia: plus 437% to USD 182 million (from USD 34 million in H1 2025)
  • Africa: plus 254% to USD 33.5 billion

All other regions saw varying levels of decreases of Chinese BRI investment: Pacific countries continue to see almost no Chinese engagement since 2019 for investment and construction. Similarly, Latin American countries continue to see little Chinese engagement (USD 584 million in construction and USD 219 million in investment). However, China is strongly engaged in Latin America with over USD 800 million investment in Brazil in 2025, albeit Brazil is not a BRI country. BRI countries in South Asia did not receive any Chinese investment announcements in H1 2026.

Good to know:
A reason for Africa’s continued strong engagement may be increasing impacts and risks of tariffs from both the US and the EU where some parts of Africa enjoy lower tariffs due to EU or US investments in the region. An example is Morocco where car makers from both the EU and China are investing to utilize lower manufacturing cost and proximity to the EU market.
Chinese engagement in different BRI regions since 2013 (top), year-on-year- change (bottom left), and regional share for construction and investment in H1 2026
Figure 4 Chinese engagement in different BRI regions since 2013 (top), year-on-year- change (bottom left), and regional share for construction and investment in H1 2026

Country analyses of Chinese BRI engagement

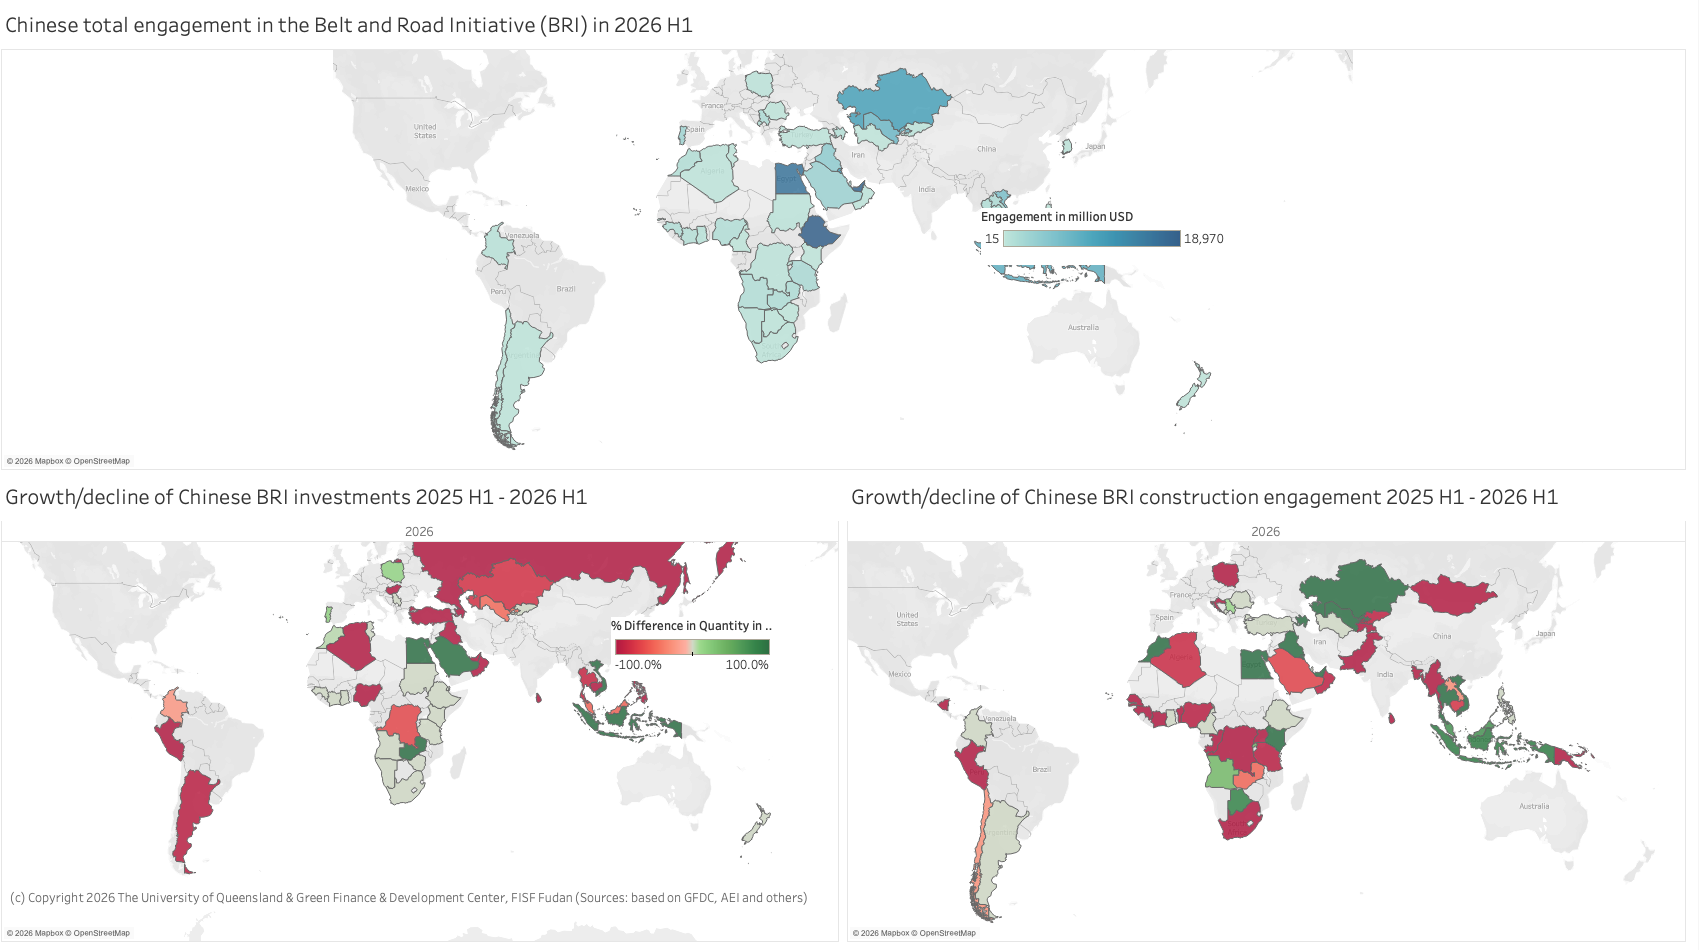
China’s financing and investment spread across 67 BRI countries in H1 2026 (down from 71 in H1 2025), with 42 (down from 45) countries receiving investments and 49 (down from 51) with construction engagement.

The countries with the largest growth in total BRI engagement were Ethiopia (+USD 18.9 billion), UAE (+USD 11.2 billion), Kuwait (+USD 10.8 billion), Egypt (+USD 9.7 billion), and Vietnam (+USD 5.9 billion).

The country with the highest construction volume in H1 2026 was UAE with about USD 18.4 billion (up from 7 billion in H1 2025), followed by Kuwait (USD 11.5 billion), Uzbekistan (USD 6.1 billion) and Vietnam (USD 5.4 billion).

Interestingly, Pakistan, a key BRI country, saw no construction contract in H1 2026.

Regarding BRI investments announcements, Ethiopia saw two significant announcements on green energy generation and green energy manufacturing worth USD 14.8 billion in H1 2026. Similarly, Egypt is again an outperformer receiving growing investments announcements to USD 12.2 billion. Other notable countries are Kazakhstan (USD 4.4 billion) and Indonesia (USD 2.8 billion). Pakistan received no investment announcements.17 countries saw a 100% drop of BRI engagement compared to H1 2025, including Pakistan, Peru, Bangladesh, Russia, and Sri Lanka (see Figure 5).

Trends of Chinese BRI engagement across different countries 2026 H1 (top) and comparison of 2025 H1 and 2026 H1 investments (bottom left) and construction engagement (bottom right)
Figure 5 Trends of Chinese BRI engagement across different countries 2026 H1 (top) and comparison of 2025 H1 and 2026 H1 investments (bottom left) and construction engagement (bottom right)

Sector trends of Chinese BRI engagement H1 2026

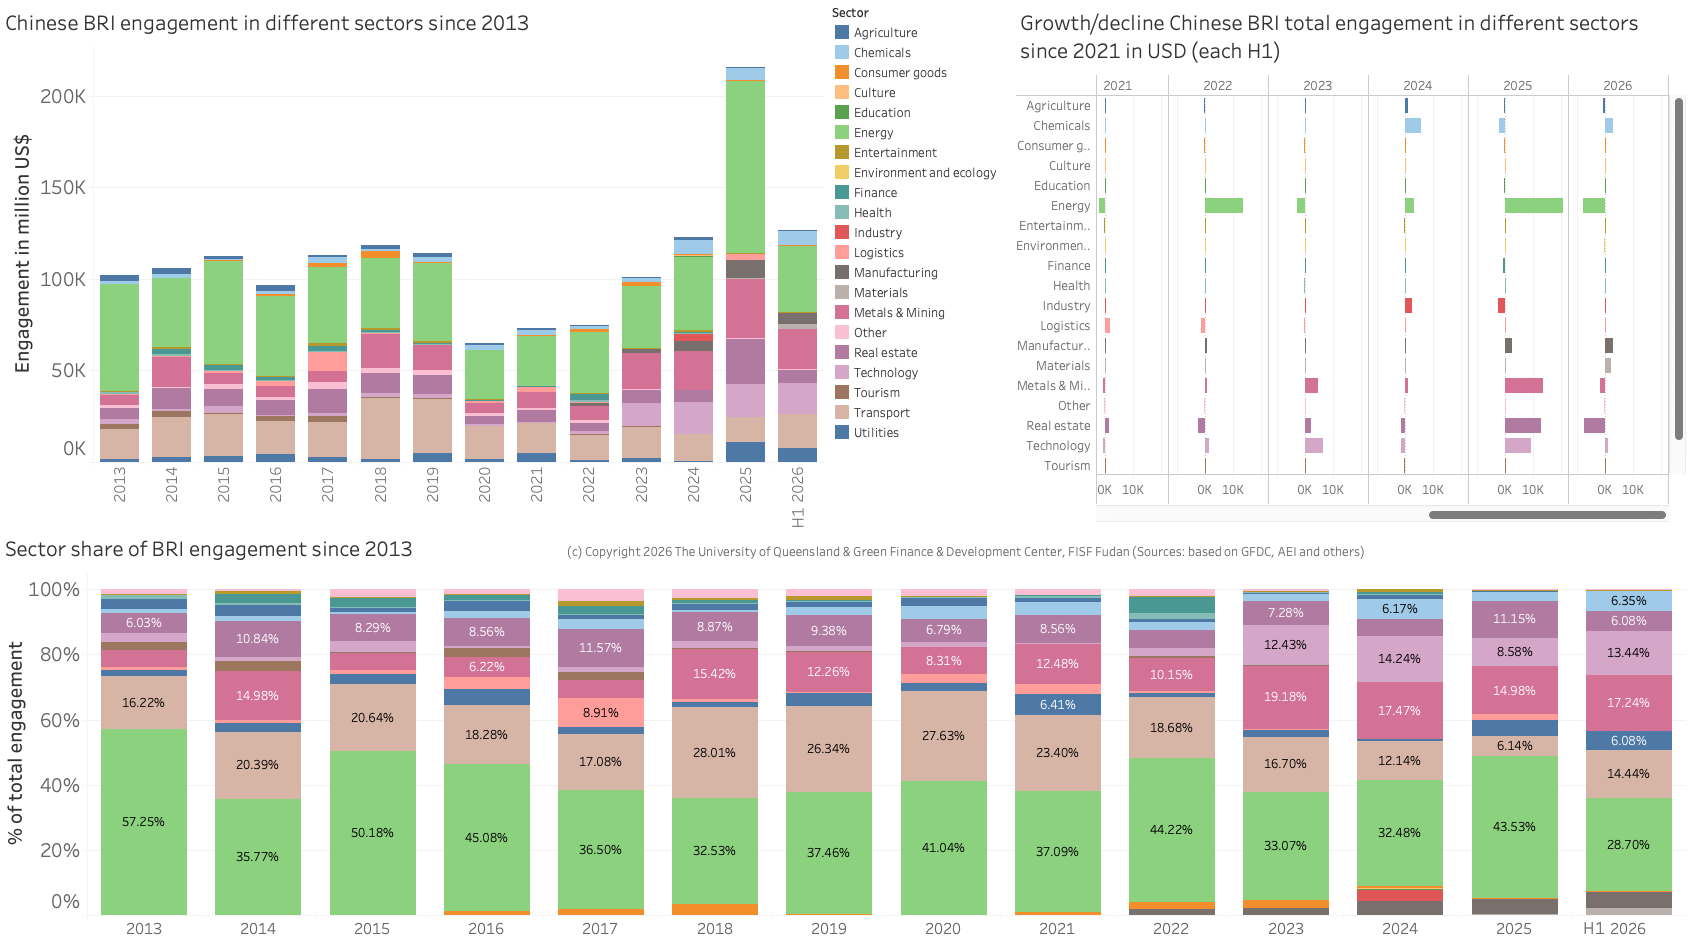
In H1 2026, particularly the transport sector (+ USD 10.6 billion), utilities (+ USD 5.5 billion), and chemicals (+ USD 3 billion) grew compared to H1 2025, while real estate dropped by USD 7 billion.

The focus of China’s overseas BRI engagement continued to be in energy (28.7% of total) with a significant decline from 2025 when the energy sector constituted 43.5% of Chinese BRI engagement. Compared to 2025, the transport sector showed some resilience and grew to reach 14.4% of the share of BRI engagement (compared to e.g., 6.1% in all of 2025 and a high of 28% in 2018). Meanwhile, the metals and mining sector kept its role as the second largest sector with about 17.2% of total (up from 15% in 2025), while the share of the technology sector expanded from 8.5% in 2025 to 13.4% in H1 2026 (see Figure 6).

BRI investments in different sectors since 2013
Figure 6 BRI investments in different sectors since 2013

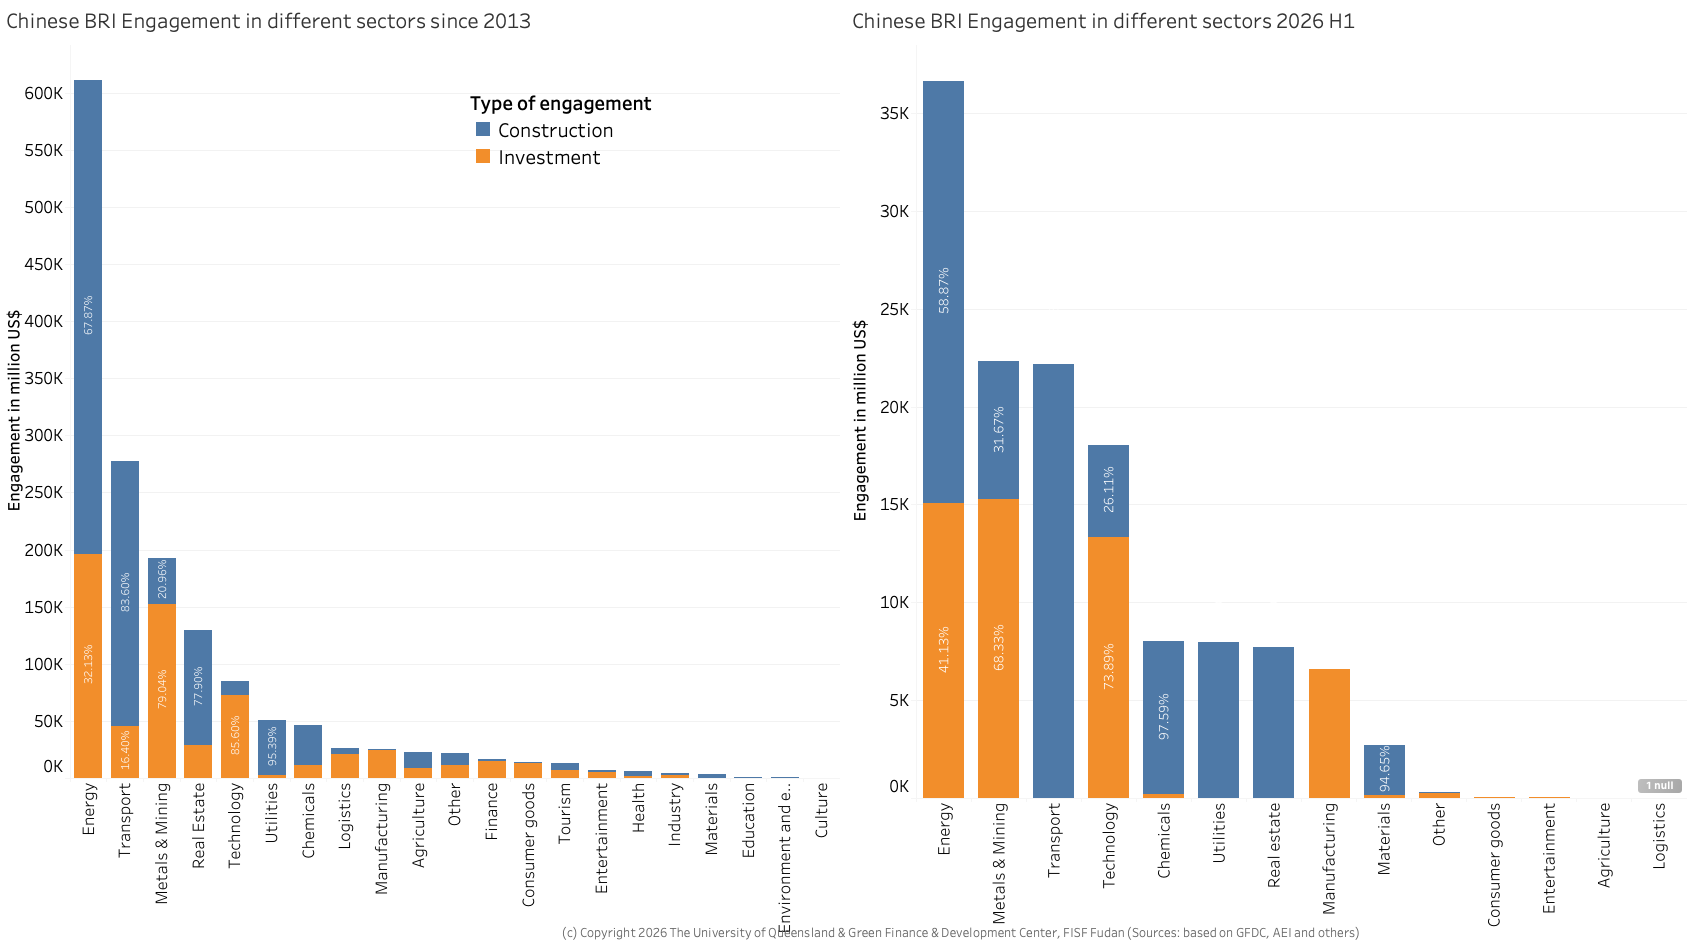
When comparing construction and investment in different sectors, some interesting trends emerge with a prevalence for investment over construction engagement

  • Metals and Mining (68% investment in H1 2026)
  • Technology (74% investment in h1 2026)
  • Manufacturing (100% investment in H1 2026)

Meanwhile, the transport sector, the real estate sector and utilities are typically driven by construction engagement (see Figure 7).

Chinese BRI engagement in different sectors through construction and investment since 2013 (left) and in 2026 H1 (right)
Figure 7 Chinese BRI engagement in different sectors through construction and investment since 2013 (left) and in 2026 H1 (right)

Technology and manufacturing engagement in the BRI 2026 H1

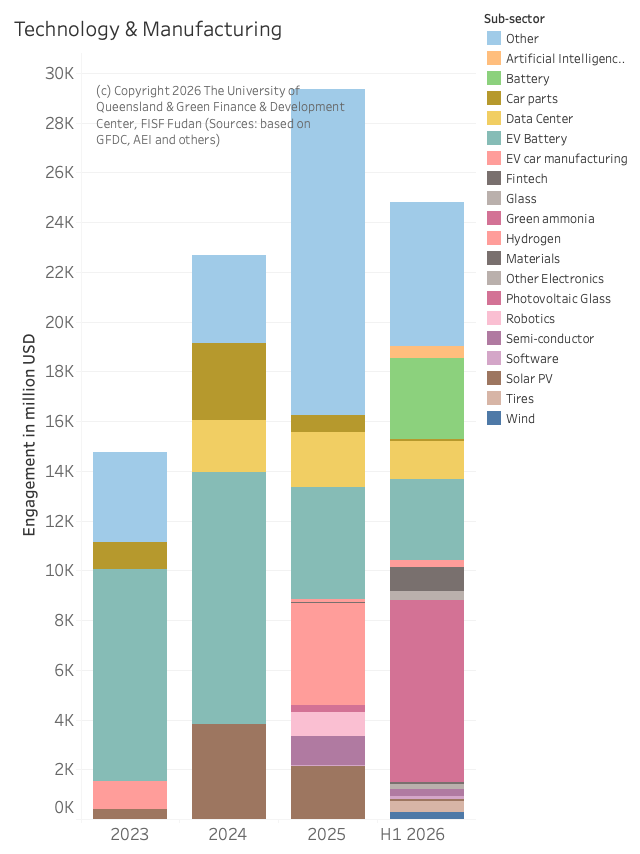
Technology and manufacturing as key growth sectors for Chinese BRI engagement reached record levels in H1 2026: Chinese engagement in in these sectors growing by about 11% (technology) and 81% (manufacturing) compared to 2025 H1 to USD 17 billion and USD 6.5 billion, respectively. Apart from general manufacturing, the technology investment saw strong increases is utility scale batteries, and significant investment in green ammonia (in Ethiopia), after significant investment in green hydrogen production in 2025 in the BRI. Solar PV manufacturing engagement continued to drop in 2026 (see Figure 8).

Notable engagements include a USD 2.6 billion construction contract in Indonesia for a battery factory delivered by BYD, or a USD 2.4 billion battery park in Portugal.

Importantly, Chinese companies are also strongly engaging outside the BRI in the tech sector, including in the USA (e.g., LONGi co-invested with Neovolta in the USA for batteries) or a USD 2.5 billion deal between Fortescue and BYD to build a battery storage system in Australia.

Technology & Manufacturing related BRI engagement 2023 to 2026 H1
Figure 8 Technology & Manufacturing related BRI engagement 2023 to 2026 H1

Metals and mining engagement in the Belt and Road Initiative 2026 H1

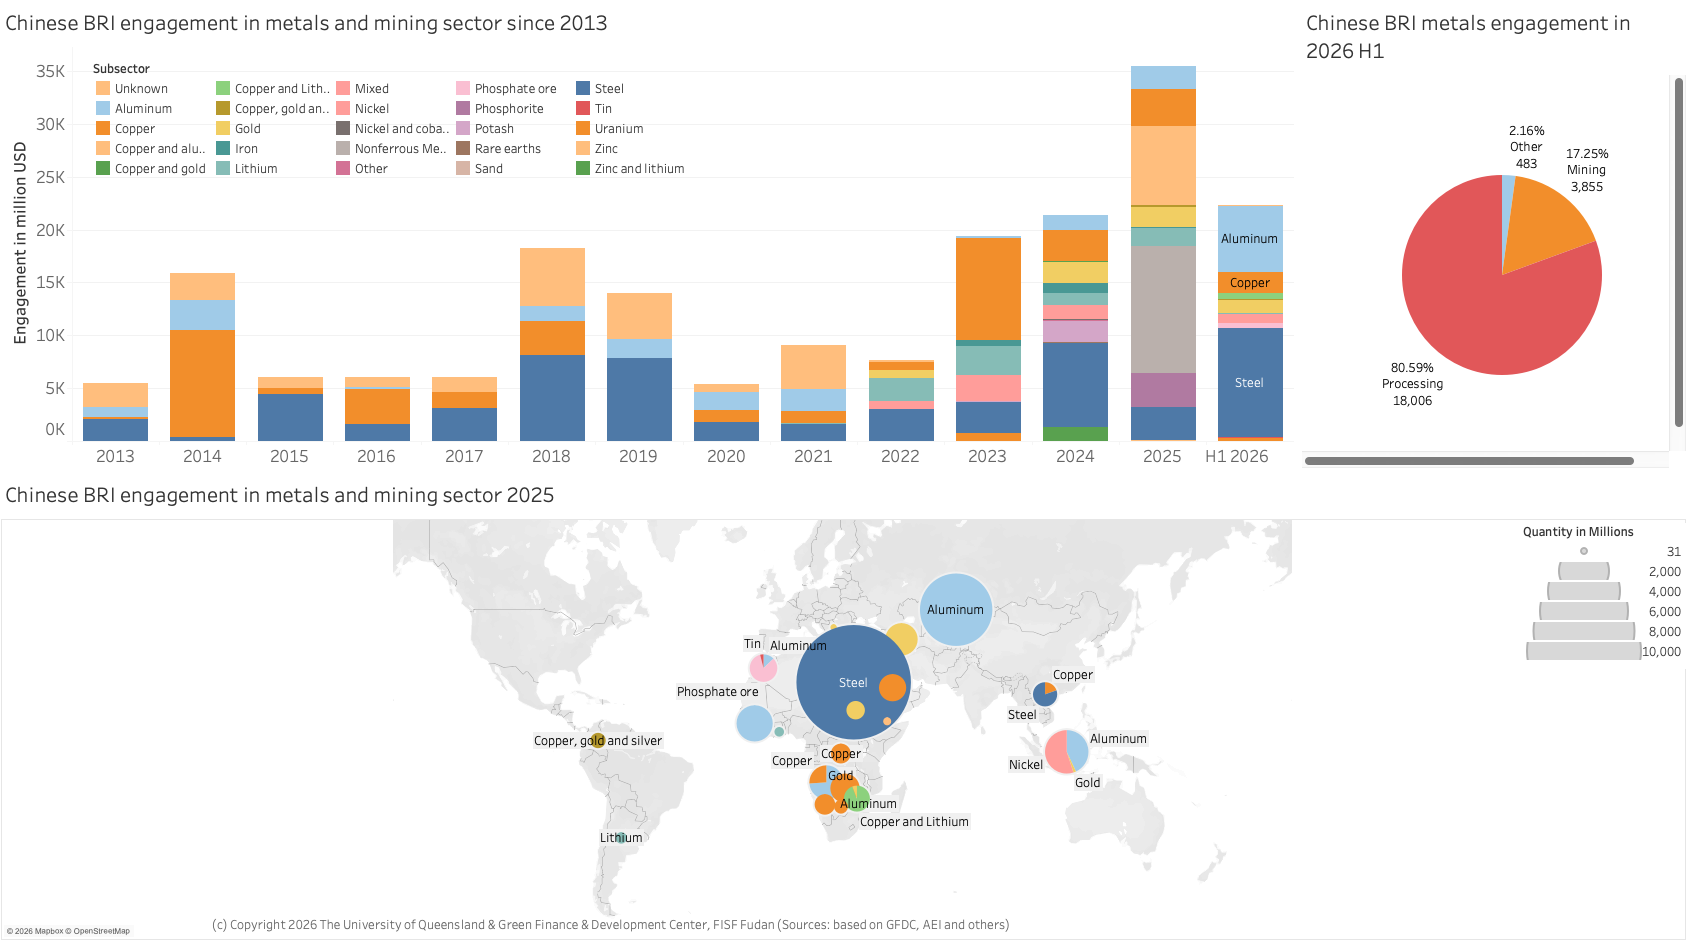
China’s engagement in metals and mining reached a record high of USD 21.8 billion in 2026 H1, which is higher than in any full year since 2013 but 2025.

Egypt was the most important recipient of Chinese metals and mining engagement with a USD 10 billion steel mill. Kazakhstan continues to be a most important partner for Chinese metals and mining, seeing announcement for two aluminum processing facilities worth USD 2.5 billion.

Indonesia, which was a top recipient of Chinese engagement for metals and mining for many years, could increase collaboration with China to a total of USD 1.4 billion in nickel, gold, and aluminum.

Good to know:
An interesting development is the focus on aluminum in the first half of 2026. An explanation can be use of aluminum in long-distance transmission lines as well as its use in the automotive sector.

It is important to note that in 2026 H1, the share of processing facilities (e.g., smelters) of the total (e.g., vis-à-vis mining) was about 80%, with 85% of the investment (about USD 13 billion) went to processing related activities (see Figure 9). This is different form 2025, where a about 43% of China’s engagement went to support mining activities.

Chinese BRI engagement in metals and mining 2013 to 2026 H1
Figure 9: Chinese BRI engagement in metals and mining 2013 to 2026 H1

Energy-related engagement in the BRI at the greenest ever recorded – more than 50% green, new coal fired power plant

China BRI Energy Overview

China’s energy-related engagement in 2026 H1 set a record as the greenest since the BRI’s inception in 2013 in absolute and relative terms.

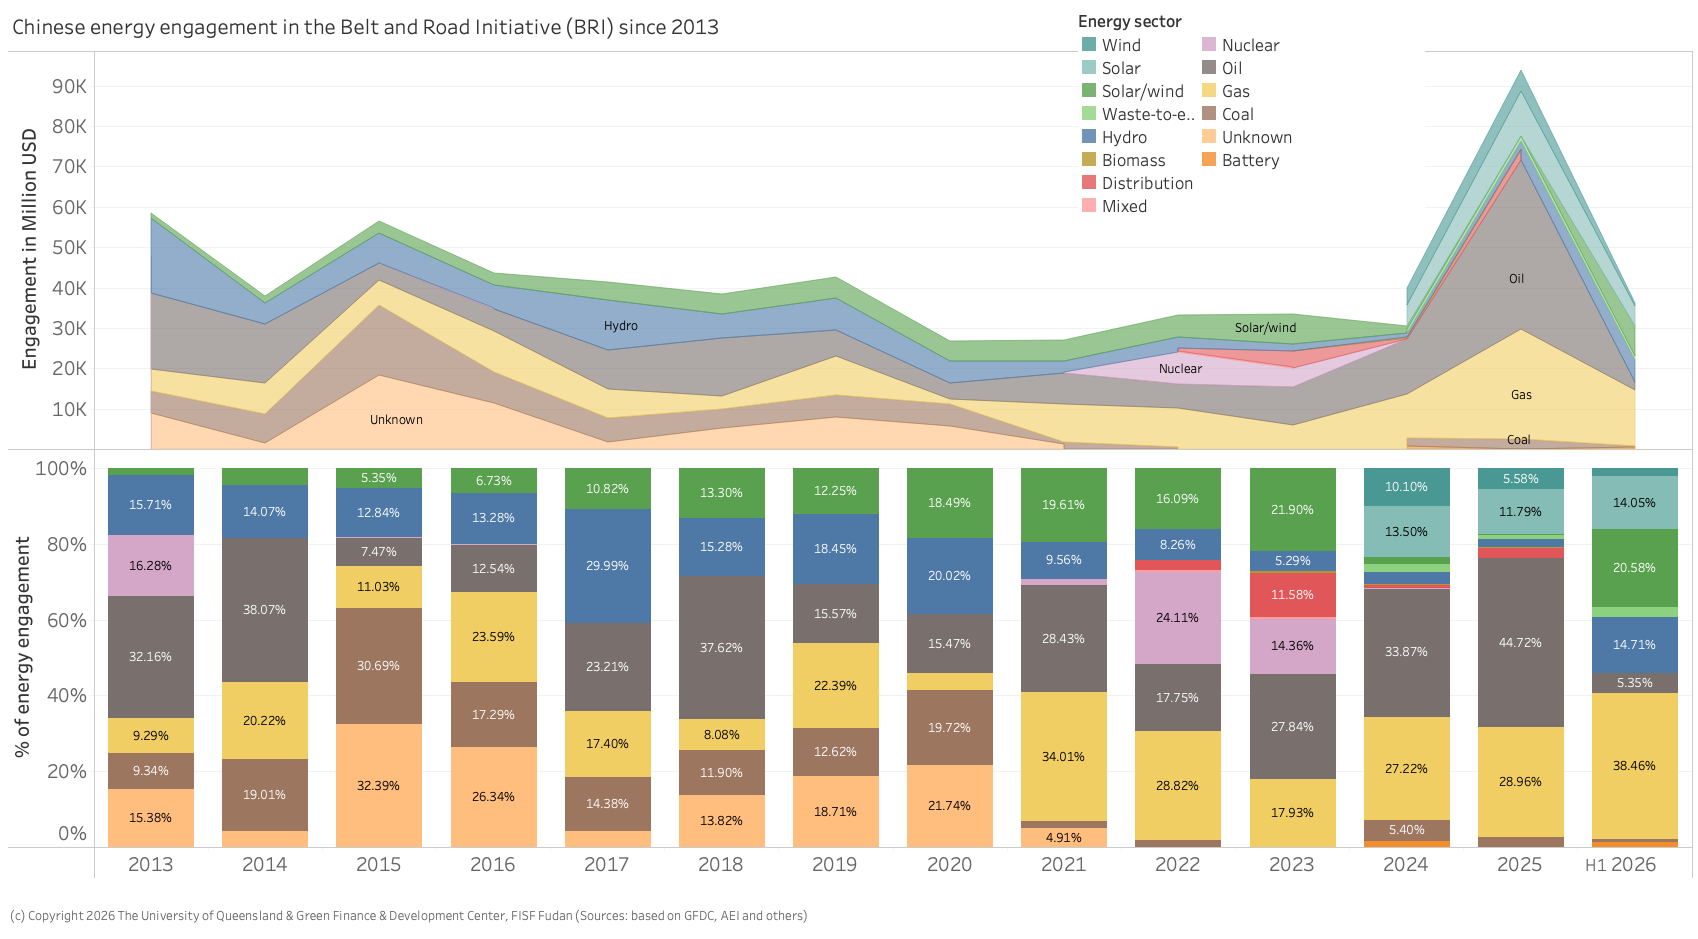
In 2026 H1, China’s energy engagement was about USD36.3 billion, which is almost double the energy engagement in any first half year since 2013 except for 2025 (see Figure 10).  

China’s engagement in green energy has also seen the highest since 2013 – with USD 14.3 billion in wind, solar, and waste-to-energy plus USD 5.3 billion in hydro.

While China continued its engagement in fossil fuels, particularly gas, but also coal with a new 600 MW coal fired power plant construction in Zambia announced in June4. Total fossil engagement was about USD 16.2 billion – the which is the second highest levels since 2020 (apart from 2025).

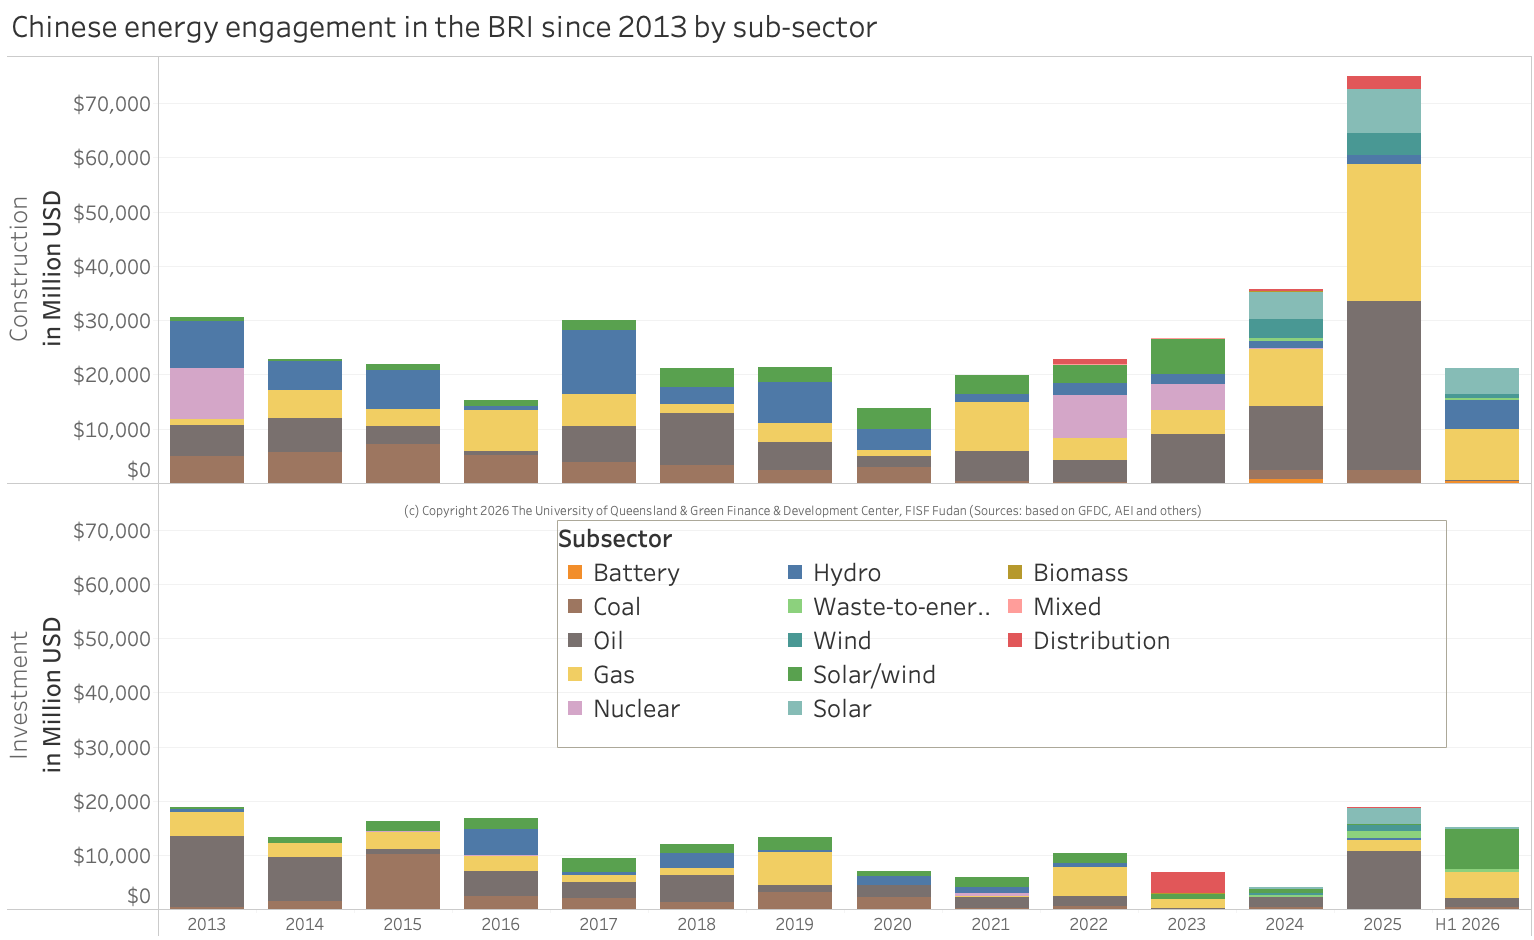
No engagement in distribution systems (e.g., substations, power lines, storage) was recorded in 2026 H1, but some battery storage projects. Cumulatively, since 2020, oil engagement topped gas engagement with USD 84.4 billion versus USD 78 billion. Solar and wind engagement reached USD 62.7 billion and has far surpassed coal, which still received about USD 11 billion despite the 2021 no coal pledge (hydro adds another USD 21 billion).

Chinese total energy engagement in the Belt and Road Initiative (BRI) 2013 to 2026 H1
Figure 10 Chinese total energy engagement in the Belt and Road Initiative (BRI) 2013 to 2026 H1

Coal

Following China’s announcement in September 2021 to not to build new coal fired power plants, China continued to engage in new coal-fired power projects seem to progress (e.g., Indonesia, Bangladesh Barisal 2, Gacko II in Bosnia).

2026 saw a continued engagement in coal-related engagement through mining operations. In June, a new 600 MW coal plant was announced in Zambia with Ziquan Group Singapore Pte Limited identified as the construction company. However, while this is an announcement, the plant still requires several approval steps.

Oil and gas

Oil and gas engagement continued to be an important part of BRI engagement reaching USD 14 billion for gas and USD 1.9 billion for oil. This is, however, a significant drop from 2025 H1 (USD 23.3 billion for gas, USD 6.9 billion for oil).

As for investments, a major deal was the USD 3.9 billion investment by Sinopec Geo-Jade Petroleum in Kazakhstan to explore a new gas field.

Meanwhile, most oil-related projects were related to processing and transportation (pipeline). This includes projects, such as the USD 1.8 billion investment into the 100,000 barrels per day (bpd) refinery in Indonesia by Nanshan Group.

Green energy and hydropower

China’s total engagement in green energy (solar, wind, waste-to-energy) and hydropower reached approximately USD20.1 billion in H1 2026, up from USD9.8 billion in H1 2025 (and USD20.7 billion in all of 2025, a previous record year).

Looking at investment only, Chinese green energy and hydropower investment increased to USD8.3 billion in H1 2026 (compared to USD5.9 billion in all of 2025 and USD1.5 billion in 2024). Meanwhile, construction projects related to green energy (including hydropower) increased to USD11.3 billion plus USD 442 million for battery storage. This compares to USD13.7 billion in all of 2025 and USD10.3 billion in all of 2024 (see Figure 11).

Chinese energy engagement through investment and construction in the BRI by subsector 2013 to 2026 H1
Figure 11 Chinese energy engagement through investment and construction in the BRI by subsector 2013 to 2026 H1

Energy sources varied

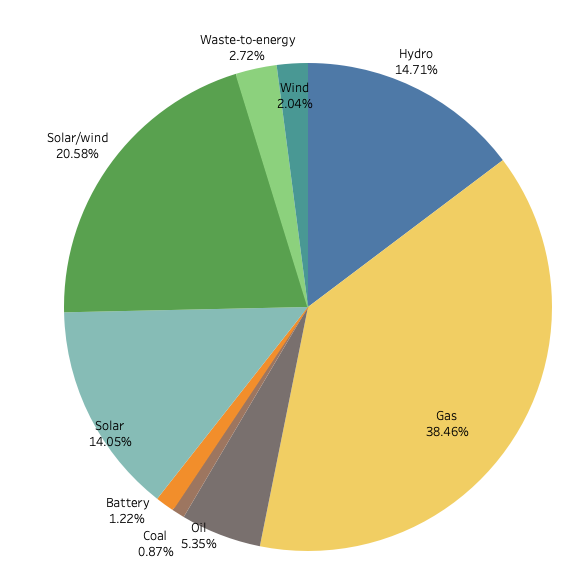
A more detailed analysis of energy sources revealed that China is engaging in a diverse range of energy projects. For the first time in multiple years, renewable energy sources took the majority (56%) of total energy engagement, while fossil is less than 50% in 2026 H1 (38% in gas, 5% in oil, and 1% coal related engagement) (see Figure 12).

Chinese energy engagement in the BRI in 2026 H1 by source
Figure 12 Chinese energy engagement in the BRI in 2026 H1 by source

Energy engagement across the supply chain

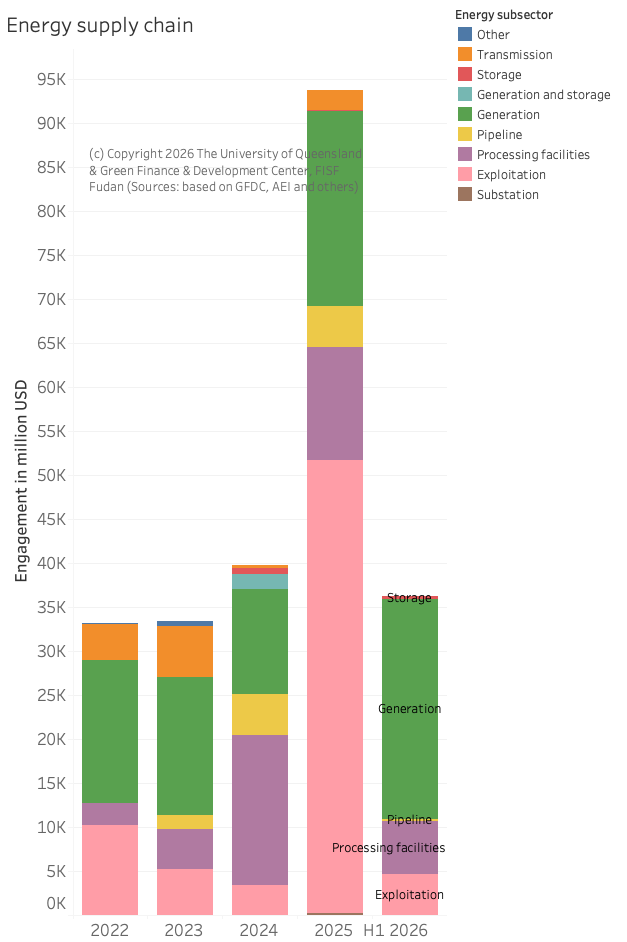
In 2026 H1, China’s engagement across the energy supply chain has focused on electricity generation, which took 69% of total engagement (or USD25 billion). This is different from the previous two years when fossil fuel related engagement in exploitation, processing facilities, and pipeline projects were dominant (see Figure 13).

Energy engagement across the supply chain 2022 to 2026 H1
Figure 13 Energy engagement across the supply chain 2022 to 2026 H1

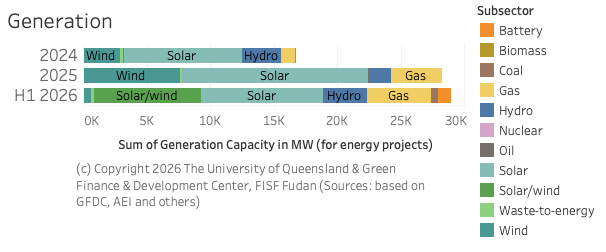
Looking at Chinese engagement in electricity generation only, Chinese engagement in 2026 H1 (USD25 billion) beat the total energy generation engagement of all of 2025 (USD22 billion). This engagement promises to add about 28 GW of generation capacity: 9.6 GW in solar, 8.4 GW in solar/wind combined, 3.4 GW in hydro, and 5 GW in gas projects (see Figure 14).

Energy generation additions in the BRI 2024 to 2026 H1
Figure 14 Energy generation additions in the BRI 2024 to 2026 H1

Energy engagement in different countries

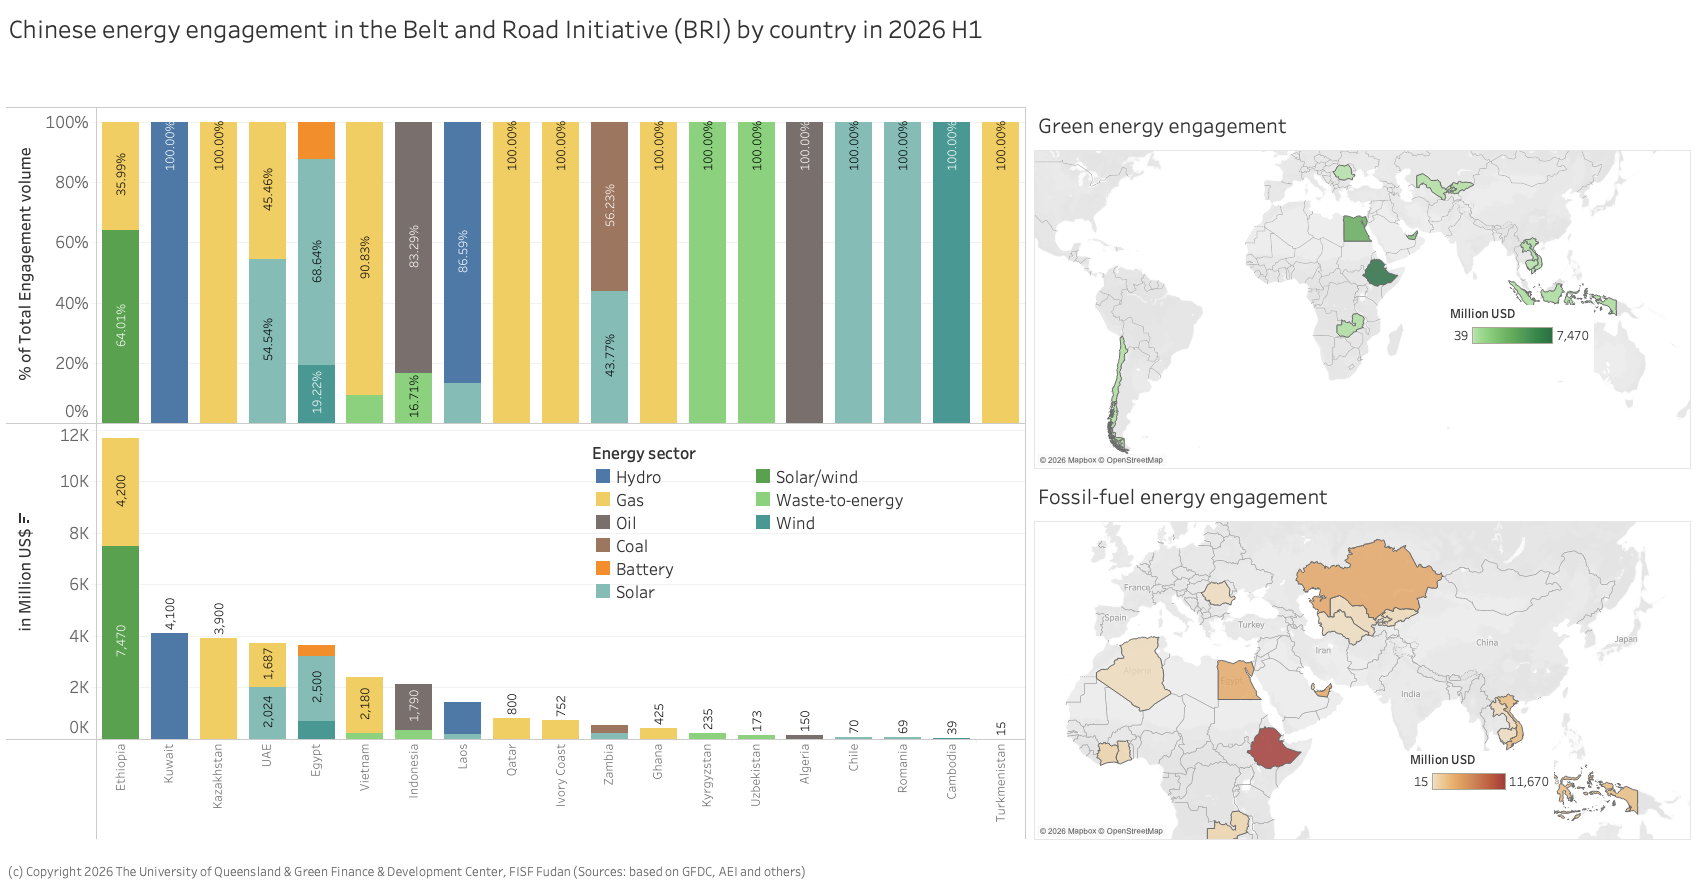
In 2026 H1, Ethiopia was the BRI country with the highest Chinese energy engagement, driven by USD 7.4 billion green energy development agreement between the Ethiopian Investment Commission (EIC) and China’s Mingyang Smart Energy Group, which marks one of the largest private foreign direct investments in Ethiopia’s history.  Initially introduced as a USD 10 billion Memorandum of Understanding at the 4th “Invest in Ethiopia” Forum earlier in the year, the scope was officially expanded and licensed in May 2026 to a total revised investment of USD 14.17 billion (including green ammonia production facilities).  The energy generation of  Phase 1 allocates USD 7.47 billion toward physical generation assets to diversify Ethiopia’s energy matrix, which relies heavily on hydropower (see Figure 15). Kuwait saw a USD 4.1 billion hydropower and desalination project with PowerChina.

Cumulatively since 2013, Pakistan remains the country with the highest Chinese energy engagement worth over USD 41.5 billion followed by Saudi Arabia with about USD 40 billion and Nigeria (USD 28 billion).

Chinese energy engagement in the Belt and Road Initiative (BRI) by country in 2026 H1
Figure 15 Chinese energy engagement in the Belt and Road Initiative (BRI) by country in 2026 H1

Transport-related engagement in the Belt and Road Initiative (BRI) 2026 H1

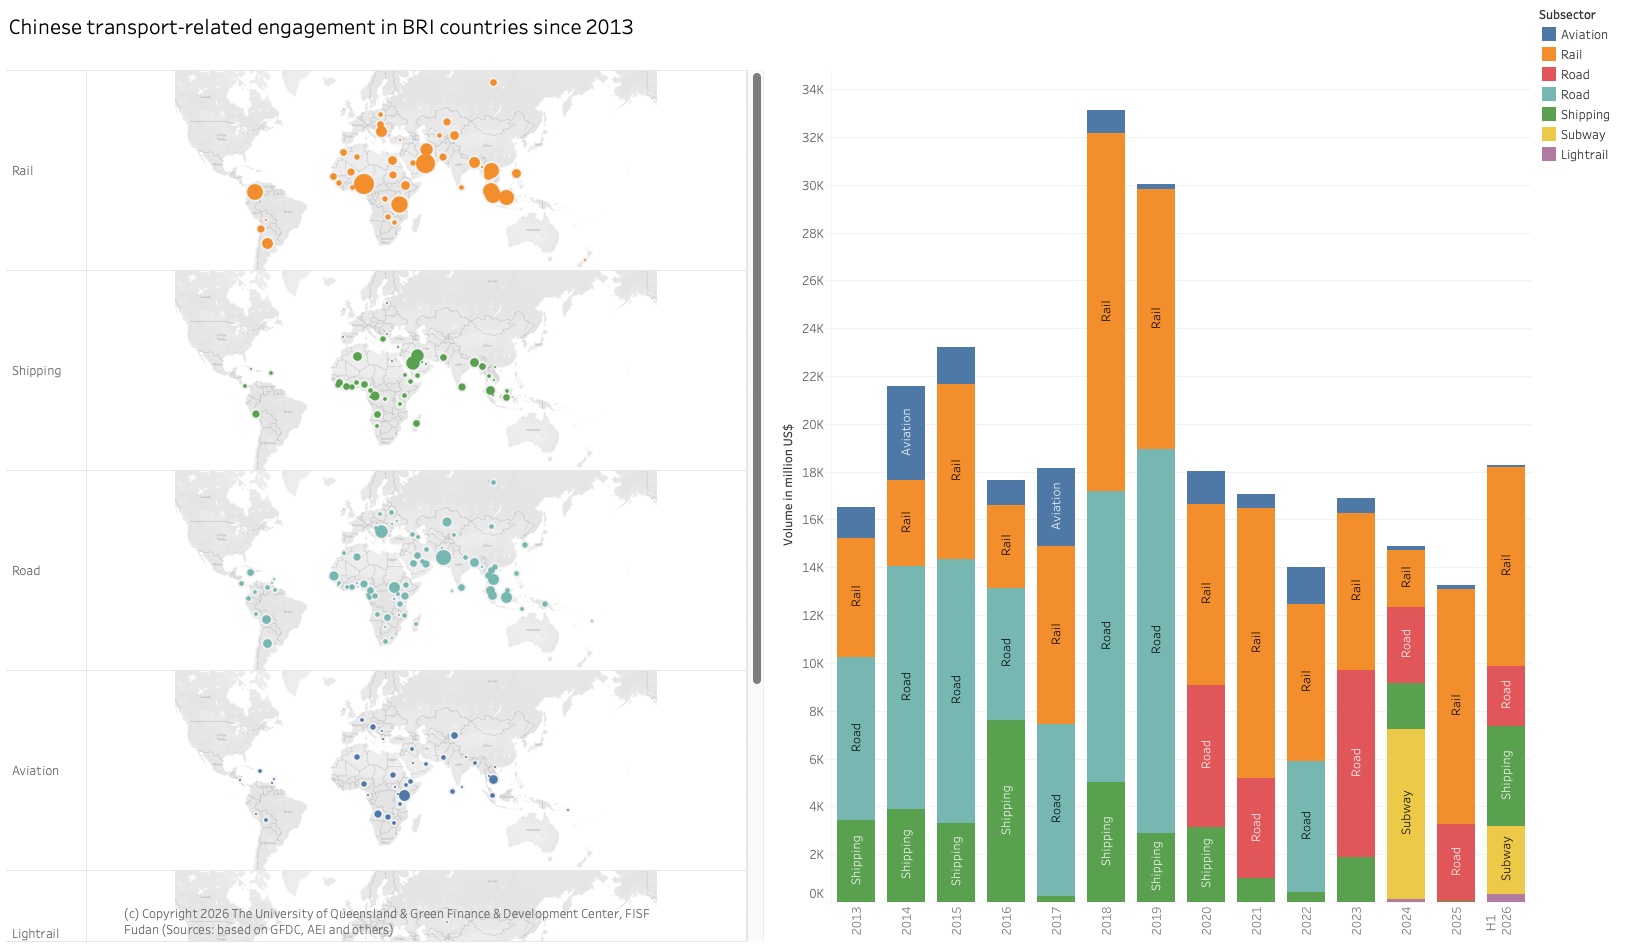
Transport-related engagement has long been a cornerstone of facilitating trade between China and the BRI countries, and trade is a core component of the BRI. To support this, China has invested in and developed projects in road, rail, aviation, shipping, and logistics across the world (see Figure 16).

In 2026 H1, transport related engagement saw significant growth compared to previous years – with the first half seeing more engagement than any full year since 2020. It is noteworthy that in 2026 H1 all transportation projects are commissioned through construction contracts (rather than investment).

Aviation: One project was announced totaling USD58 million, which is support for the Phu Quoc International Airport in Vietnam.

Rail: Total rail engagement (including light rail and subway) was worth USD11.7 billion (more than in all of 2025) the Dubai High Speed Railway projects stands out with involvement from State Construction Engineering and China Communications Construction Company (CCCC) worth about USD8 billion. In Vietnam, China Railway Engineering (CREC) signed the construction deal for the second metro line in Ho Chi Minh City worth USD2 billion.

Road transport: China continues to engage in road construction projects across multiple BRI countries, with a total value of USD2.5 billion in 2026 H1. Noteworthy is the USD1.5 billion agreement with Serbia to construct the Vožd Karadjordje Expressway.  Ports: About USD4.2 billion in shipping related project was found in 2026 H1 in BRI countries, most notably the EPC General Contracting Contract for the First Phase of the Mubarak Port Project in Kuwait worth USD4.1 billion.

Chinese engagement in BRI transport infrastructure 2013 to 2026 H1
Figure 16 Chinese engagement in BRI transport infrastructure 2013 to 2026 H1

Major players in China’s Belt and Road Initiative (BRI) – a growing dominance of private enterprises over state-owned enterprises

In 2026 H1, Chinese private enterprises took a dominant role in investment and growth in construction projects.

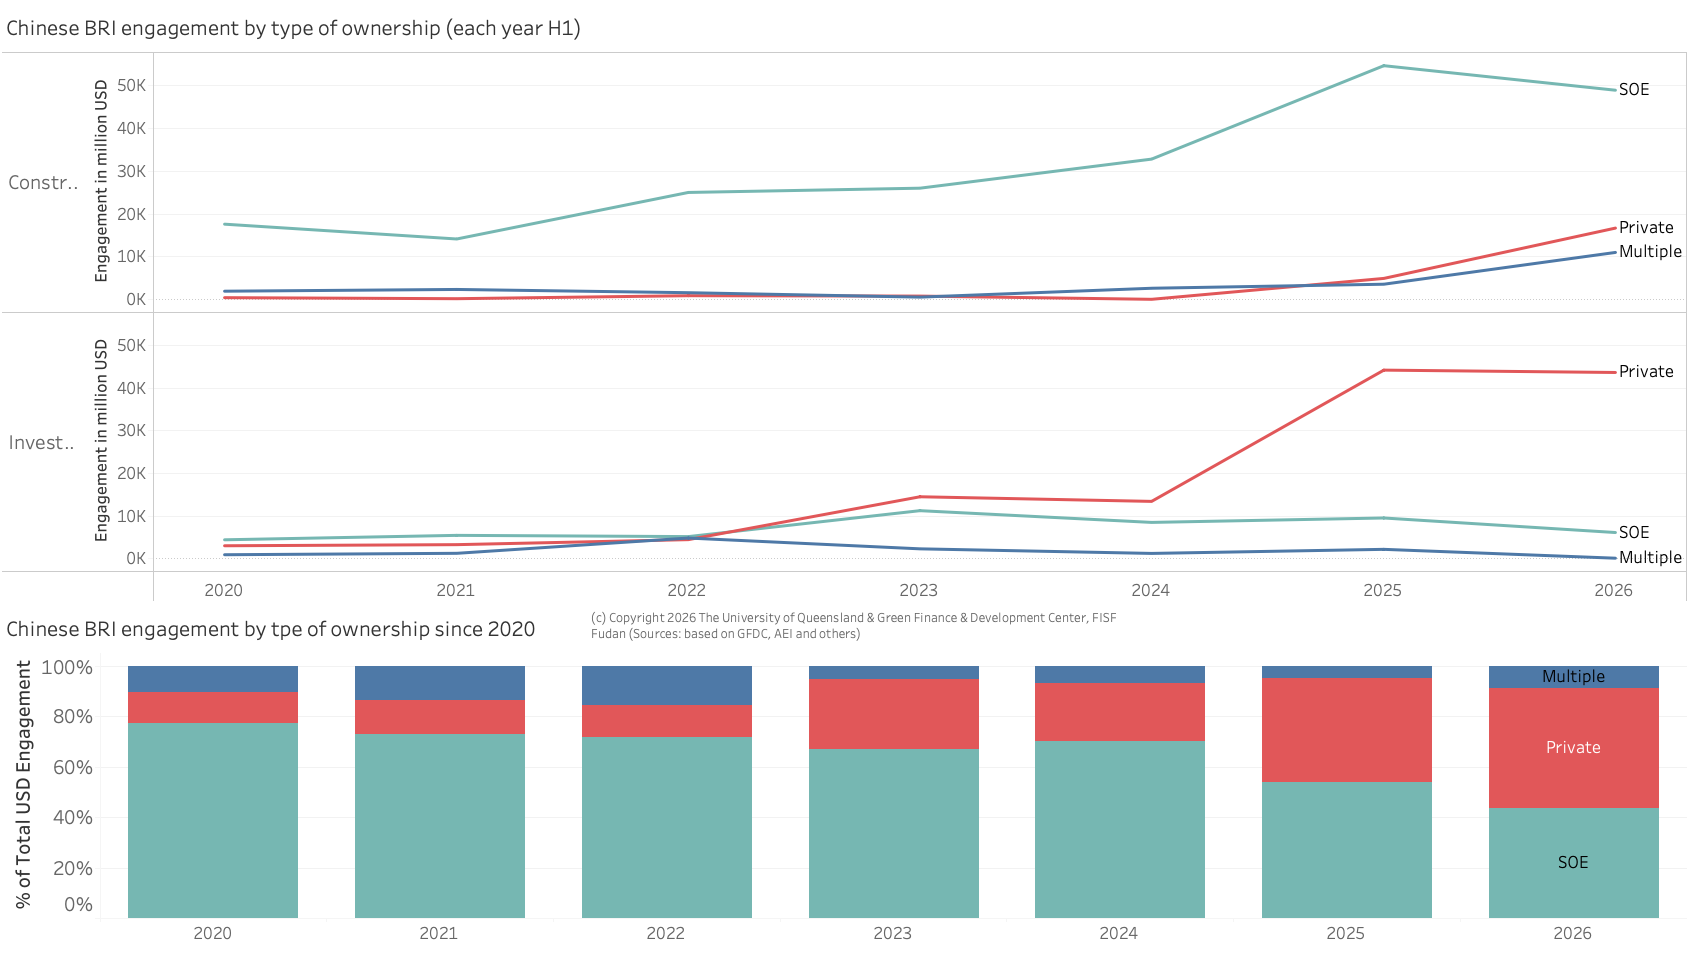
Privately owned Chinese companies (as opposed to Chinese provincial or central state-owned enterprises, SOEs) play an ever more important role in delivering projects and investing in BRI countries. The share of private sector companies of total engagement (USD) grew from 12.5% in 2020 to 47.7% in 2026 H1.

Particularly since 2025, with a rapidly growing investment portfolio, private companies have taken the lead in providing finance, often from their balance sheets. Meanwhile, SOEs remain dominant for construction projects, where their footprint is about 3 times bigger than those of private companies. Yet, the gap is narrowing in 2026 H1, with the multiple shrinking from 11 in 2025 H1 (see Figure 17).

Ownership type (SOE, private) of companies engaged in the BRI through construction and investment projects
Figure 17 Ownership type (SOE, private) of companies engaged in the BRI through construction and investment projects

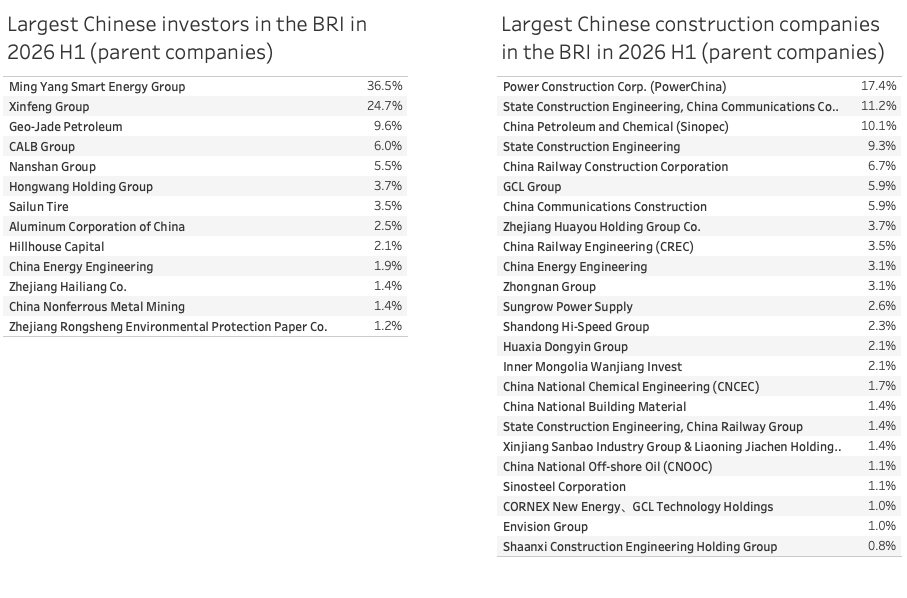
For investment projects, Ming Yang Smart Energy Group and Xinfeng led ahead of Geo Jade Petroleum and CALB Group (all private companies). The Chinese companies most prominently featured in construction projects in the BRI in 2026 H1 were PowerChina, State Construction Engineering and China Communications Construction Corporation, and followed by Sinopec (all SOEs). Private companies like Sungrow and Envision also played an important role in 2026 H1.

Main investors and construction companies in the Belt and Road Initiative in 2026 H1
Table 1 Main investors and construction companies in the Belt and Road Initiative in 2026 H1

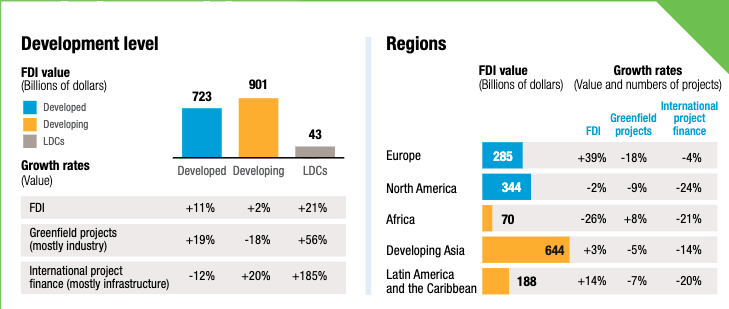
Latest reliable data on FDI in emerging economies encompasses 2025: UNCTAD7 reports in its World Investment Report that global FDI rose by 6% to USD1.6 trillion in 2026. Most of the FDI went to developing countries (USD901 billion) as compared to developed countries (USD723 billion).

Mian recipients were USA, Singapore, Hong Kong (China), and Brazil. Most important investors were the USA (USD263 billion), Japan (USD186 billion), and China (USD 174 billion) (see Figure 18). Particularly important growth sectors for global FDI are data centers as well as oil and gas exploration, while renewable energy saw some declines.

Global Foreign Direct Investment (FDI) trends (Source: UNCTAD)
Figure 18: Global Foreign Direct Investment (FDI) trends (Source: UNCTAD)

To understand China’s role for FDI in global comparison, and utilizing only official data, it quickly becomes clear that China’s FDI ratio (i.e., FDI normalized by its GDP) is comparable to that of the USA at about 0.84% and much smaller than those of other export oriented countries like Germany (1.7%), The Netherlands (4.0%), Japan (4.2%), or UAE (10.1%) (see Figure 19).

FDI to GDP ratios of selected economies 2025
Figure 19 FDI to GDP ratios of selected economies 2025

Outlook for China’s Belt and Road Initiative (BRI) engagement beyond 2026 H1

Chinese finance and investments into the Belt and Road Initiative (BRI) countries in 2026 H1 have continued a similar trajectory to that of the 2025 record year.

For the rest of 2026, a further expansion of BRI investments and construction contracts seems possible despite (or because of) global economic headwinds driven by US-led trade impositions and the fossil fuel volatility driven by the Strait of Hormuz crisis. This can drive investments to boost green energy growth and related industries including continued opportunities for mining and minerals processing deals, technology deals (e.g., EV manufacturing, battery manufacturing) and green energy (e.g., energy production and transmission). China refers to these industries (electric vehicles, batteries and renewable energy) as the “New Three”.

Furthermore, global trade volatilities and uncertainties can spur investments in supply chain resilience and exploration of new markets by Chinese companies. However, risks emerge due to uncertainty of possible growing trade sanctions vis-à-vis China including, possibly, from the European Union (EU) and a risk of secondary sanctions for trade with China should the US aim to pursue this.

Nevertheless, with strong momentum in emerging economies, the mainstay of the BRI, I expect Chinese BRI engagement to continue on strong growth trajectory in 2026.

With strong engagement in sectors requiring significant investment (e.g., mining, manufacturing), and increasing ability to scale energy investment as well as data centers, I expect deal size to also remain large.  

About our partner – The Green Finance & Development Center

This report was developed with the University of Queensland (UQ) Business School and the Green Finance & Development Center

Definition of regions of countries in the Belt and Road Initiative (BRI)

Map of Belt and Road Initiative (BRI) countries by region

[1] For comparison reasons: if only including deals larger than USD 100 million as was done before 2024, construction engagement would be USD 74.8 billion and investments would be 47.9 billion USD, with a total engagement of 122.7 billion – a relatively minor difference.

[2] For comparison reasons with slightly different data collection approaches since 2024, the analysis focuses on deal size larger than USD100 million in this analysis (see About Data section on first page). If all deal sizes including those smaller than USD 100 million are included in this calculation, the deal size for investment was USD 587 million and USD 626 million for construction contracts.

[3] For a definition of the regions, see map at the end of the report.