This new in-depth analysis of Asia-Pacific green economic transition analyzes cleantech and green trade, investment in manufacturing and utilization of solar, wind, batteries, New Energy Vehicles (NEVs) and related equipment. It is co-written by Christoph Nedopil (UQ), Michael Davidson (UCSD), Jieune O’Neill (UCSD), Andres Perez-Corsini (UCSD), Sandy Qian (UCSD), and Tong Niu (UQ).
Highlights of Asia-Pacific Green and Cleantech trade, manufacturing investment and utilization
Asia Pacific (APAC) economies are going through a green transition, which requiresbalancinggreen tech utilization (e.g., green energy installations), strengthening domestic green tech manufacturing, and expanding green tech trade to import readily available cleantech and/or export domestically produced cleantech.
Across APAC, economies are following distinct green transition pathways. India and Viet Nam combine strong green technology deployment with manufacturing development; Australia, Pakistan and the Philippines rely more heavily on imported technologies; Malaysia and Thailand have export-oriented manufacturing profiles; Indonesia is emerging as a local value-adding economy, driven by substantial manufacturing investment despite lower deployment and net imports; Bangladesh remains a low-intensity transition economy.
Renewable energy deployment has been led by India, Australia and Viet Nam. Between 2015 and 2025, India added 172 GW of renewable capacity, representing 72% of its net capacity additions, while Australia added 48 GW. Viet Nam added 32 GW between 2015 and 2024, although 89% of its solar expansion was concentrated in 2019–2020. By contrast, Indonesia added only 4.1 GW of renewables compared with 31.4 GW of coal capacity.
Electric mobility is expanding fastest in Viet Nam and India. Growth has been driven particularly by electric two- and three-wheelers, with the Philippines also seeing increasing adoption in these segments. Viet Nam recorded rapid electric-car adoption, with EVs accounting for more than 10% of its passenger-car stock in 2025, while adoption remained limited in Indonesia and Malaysia.
Green technology trade reflects different levels of industrial integration. Australia, Pakistan, Bangladesh and the Philippines remain predominantly import-dependent; India, Indonesia and Thailand combine substantial imports and exports; and Viet Nam and Malaysia have developed more export-oriented profiles. Nevertheless, most economies remain highly dependent on China, including for more than 60% of EV and battery imports in most cases. Furthermore, many exporting economies are subject to volatility in U.S. trade policies.
Green technology manufacturing investment has accelerated since 2021 but remains concentrated in specific economies and technologies. Indonesia and India attracted the largest announced investment volumes, with battery manufacturing dominating recent announcements. China is the main source for APAC (ex China) cleantech manufacturing investments, particularly in Malaysia, Thailand and Indonesia where it accounted for 50% of identified battery manufacturing projects.
Deployment, manufacturing and trade should be treated as complementary but distinct policy objectives. Investment announcements and trade surpluses do not necessarily translate into domestic production, employment or technological capability; policies should therefore target competitive value-chain segments while avoiding measures that unnecessarily slow green technology deployment.
Introduction – the Green Economy Transition Triplet
Governments across Asia-Pacific pursue two related objectives: accelerating the deployment of clean technologies such as solar, wind, and electric vehicles, while many aim to capture greater economic value by building domestic cleantech manufacturing capacity rather than relying on readily available, often cheaper imports. India, for example, aims to establish a self-reliant clean energy manufacturing system including a complete indigenous solar value chain by 2028, while Indonesia aims to attract green manufacturing investment by implementing local content requirements (TKDN) for green electricity projects.
However, the objectives of fast cleantech deployment and domestic manufacturing capacity may pull policy in different directions: The demand for rapid renewable energy and electric mobility deployment can often be satisfied through readily available low-cost imports—especially from China. Meanwhile, strategies focused on building domestic manufacturing capacity may require strong domestic demand for domestically produced clean technologies or strong export opportunities, and they often need to overcome competitive disadvantages vis-à-vis Chinese manufacturers. Building domestic manufacturing capacity thus may require investment support, market protection, local-content measures to generate demand, as well as time to establish competitive supply chains. For policymakers, it is important to understand how to navigate the opportunities and challenges in their green economic transition, balancing green tech utilization, green local manufacturing, as well as green trade through imports and exports. The Figure below shows how these three factors interact in the “green economic transition triplet”: Optimizing for any of these dimensions will have positive or negative interactions with other dimensions. For example, focusing on domestic content requirements for green tech utilization aims to spur green manufacturing and reduce imports. However, without sufficient domestic demand for clean technologies, investors will not build cleantech factories, and greentech utilization will decelerate.
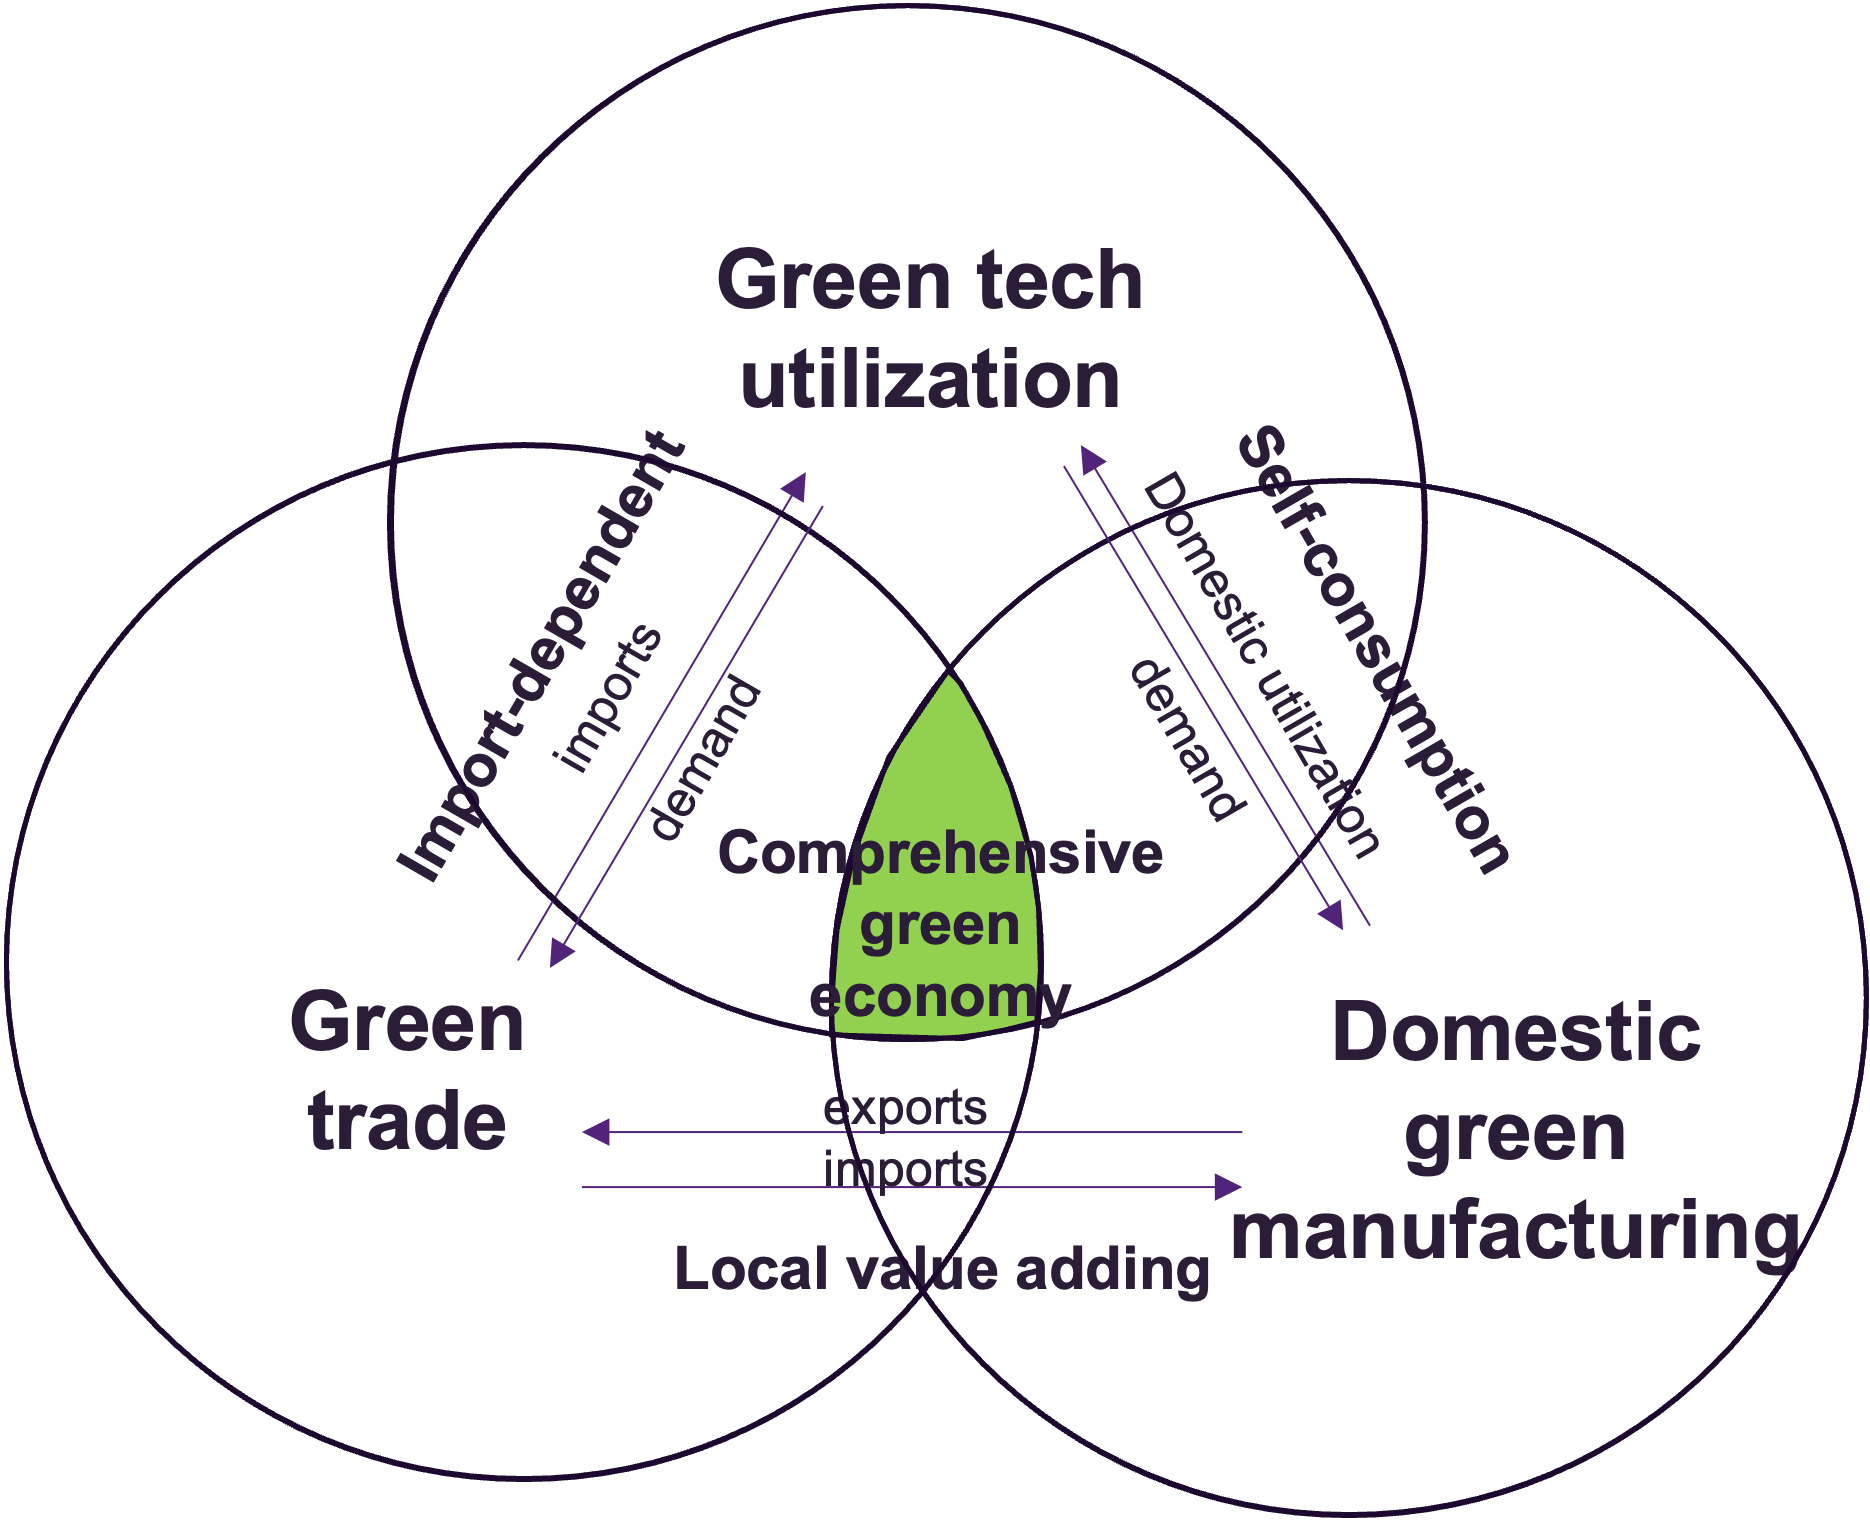
The green economic transition triplet suggests five green transition pathways:
- Import-dependent economies that utilize green imports to strengthen the green economic transition without relevant domestic green manufacturing
- Self-consumption economies that build green manufacturing capacity for domestic use
- Local value-adding economies that have significant green manufacturing capacity (mostly assembly) to add value to imported semi-finished products for export
- Comprehensive green economies that have built a strong green ecosystem that boasts green manufacturing capacity with strong domestic utilization and trade
- Low-intensity transition economies without significant focus on any green transition factor.
To understand how Asia-Pacific (APAC) economies are addressing the green economic transition, this report analyzes the latest available data of nine APAC economies (Australia, Bangladesh, India, Indonesia, Malaysia, Pakistan, the Philippines, Thailand and Viet Nam) across the three dimensions of green economic transition:
- Domestic deployment of renewable-energy technologies and new energy vehicles with data from 2015 to H1 2026;
- Cross-border trade in selected low-carbon technology products (with comparisons to the USA and China) with data from 2002 to 2025; and
- Domestic cleantech manufacturing investment in solar, wind, battery and EV manufacturing with data from 2015 to H1 2026.
We find economies across Asia-Pacific have typically adopted one of the pathways to optimize this transition triplet.
We also acknowledge important limitations of this approach as the three indicators do not measure all dimensions of green industrial development. In particular, trade balances do not directly measure domestic value added, and investment announcements do not necessarily translate into operating production capacity, employment or technology transfer. The framework therefore identifies indicative development profiles rather than ranking countries’ policy success.
Green Technology Utilization Trends in Asia-Pacific
The following chapter analyzes how economies across Asia-Pacific utilize green technologies related to electricity generation and transportation.
Green Electricity Utilization
All nine analyzed APAC economies have expanded power generation capacity. However, significant differences appear in deployment speed and technology mixes, including green energy sources.
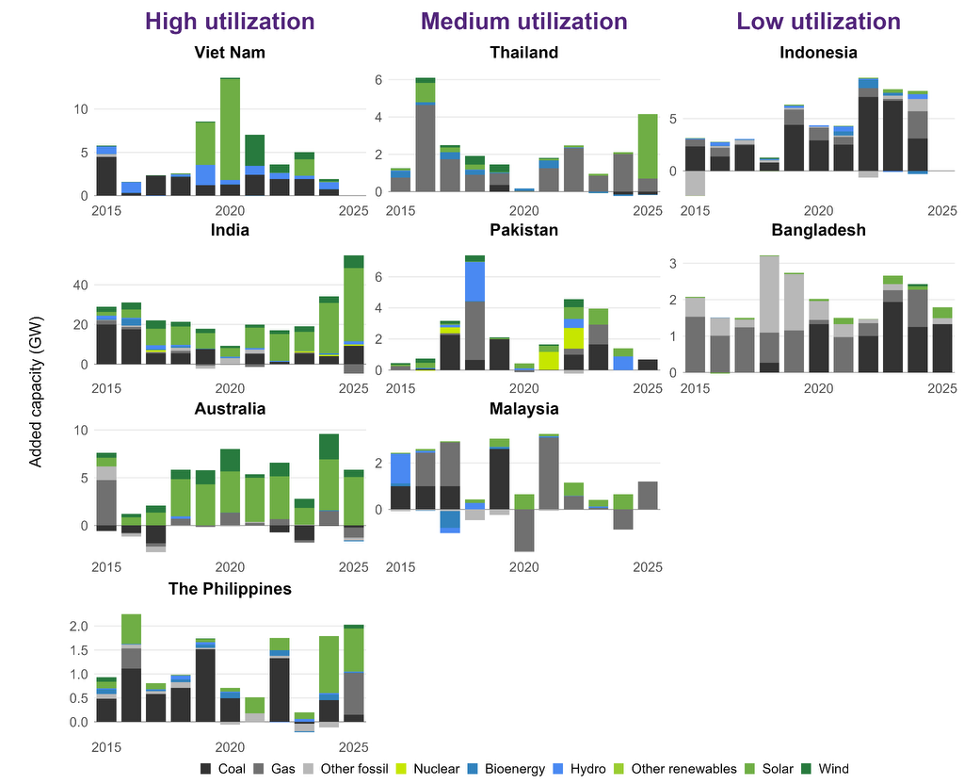
- High utilization: Viet Nam, India, Australia and the Philippines have shown the strongest overall adoption. Viet Nam and, to some extent, India initially relied on hydropower before shifting towards solar, whereas Australia had an earlier start with solar and wind. Between 2015 and 2025, renewables contributed 172 GW (72%) of India’s net capacity additions, while Australia added 48 GW of renewable capacity. In Viet Nam, renewables contributed 32 GW (69%) between 2015 and 2024, with 89% of its solar growth concentrated in 2019–2020. The Philippines’ expansion was smaller but accelerated recently, adding 4.6 GW of renewable capacity, mainly solar.
- Medium utilization: Thailand, Pakistan and Malaysia have expanded renewable and other low-carbon technologies while continuing to rely on fossil fuels. Thailand added 8.0 GW of renewable capacity, primarily solar, but also added 15.1 GW of gas capacity. Pakistan combined 9.4 GW of renewable additions with 2.8 GW of nuclear capacity, alongside continued coal and gas expansion. Malaysia’s recent renewable growth was driven mainly by solar, while coal and gas remained dominant.
- Lower utilization: Indonesia and Bangladesh added relatively limited renewable capacity. Indonesia followed a diversified pathway involving hydro, bioenergy, geothermal and solar, but renewables contributed only 4.1 GW (9%) of its net capacity additions between 2015 and 2024, compared with 31.4 GW of coal. Bangladesh added approximately 1.0 GW of renewables which was mostly solar, representing only 5% of its net expansion, while most new capacity came from gas, coal and other fossil fuels.
New Energy Vehicle (NEV) Adoption
Adoption of new energy vehicles (NEVs) including cars, buses, vans and two- and three-wheelers varies significantly across the observed APAC economies:
- High utilization: Viet Nam and India have started to adopt NEVs, in particular two- and three-wheelers since 2015. Since 2022, cars with electric engines have also started to see stronger growth. For example, in Viet Nam, electric cars make up more than 10% of the total vehicle stock in 2025.
- Medium utilization: Thailand, Australia and the Philippines occupy an intermediate position. While electric vehicles accounted for approximately 2.5% of the passenger-car stock in Thailand and Australia in 2025, NEV adoption in the Philippines has been driven primarily by electric two- and three-wheelers.
- Slow utilization: Indonesia and Malaysia continue to rely predominantly on internal combustion engines for road transportation, with EVs accounting for less than 1% of the passenger-car stock in 2025
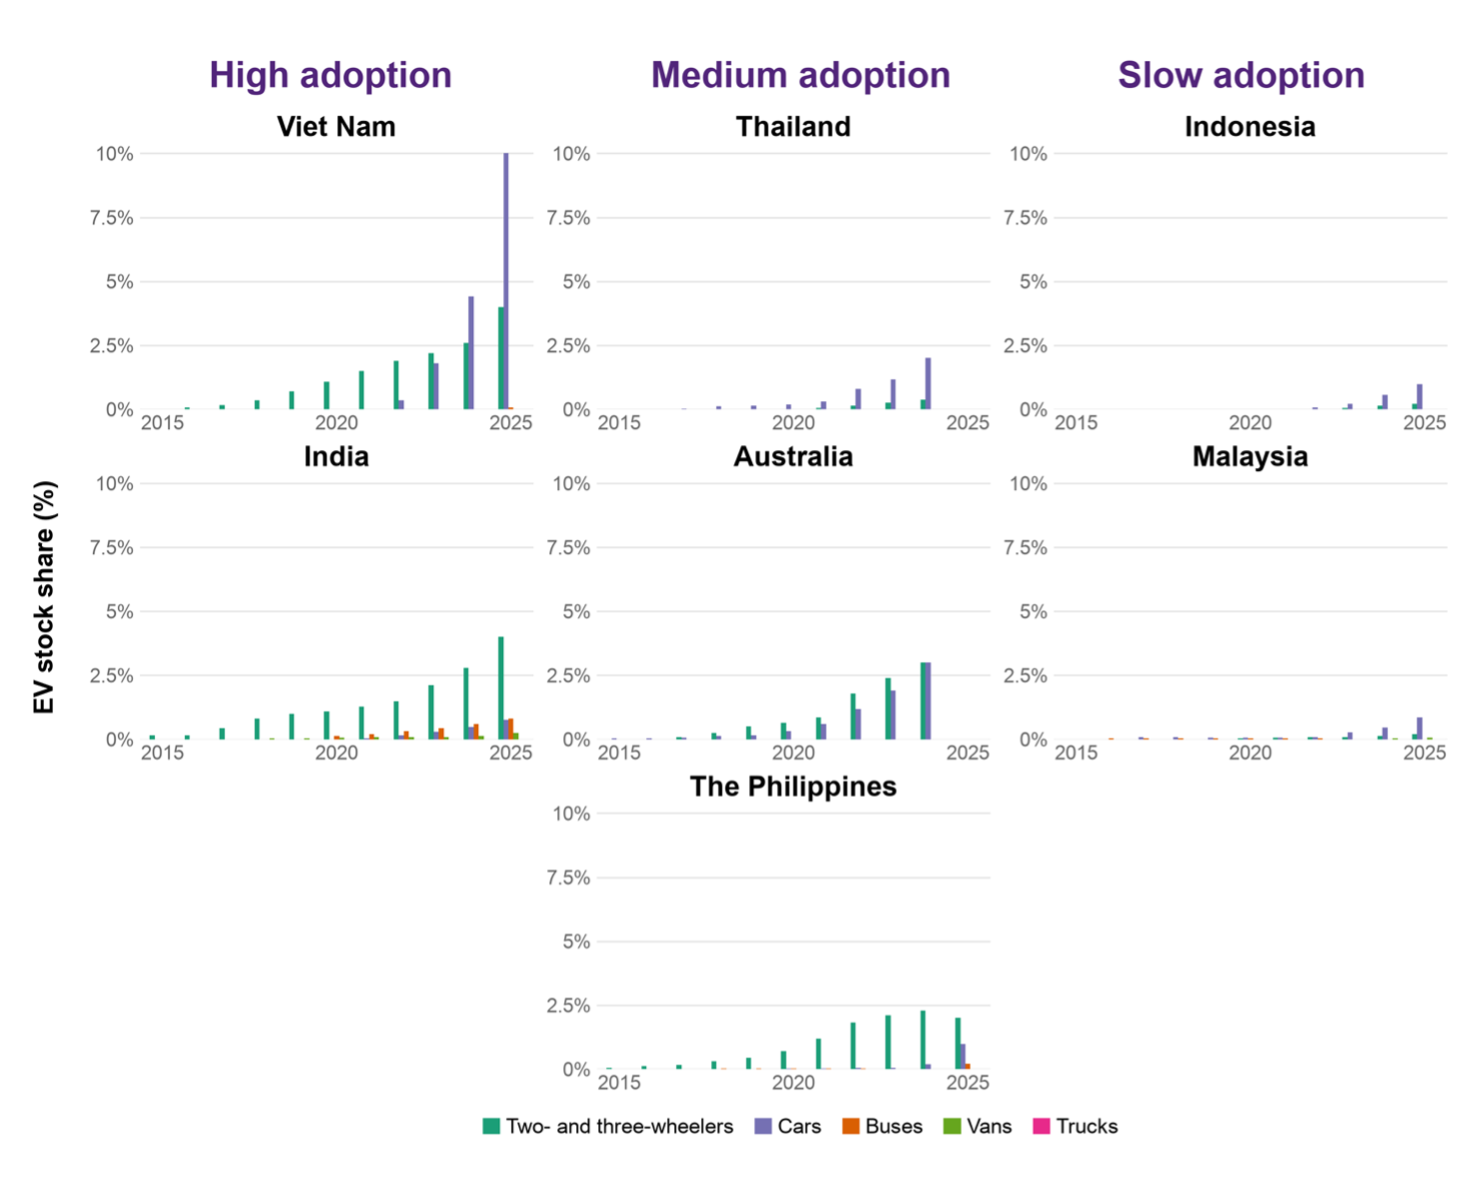
Note: Data not available for Pakistan and Bangladesh.
Source: Authors’ calculations using the International Energy Agency’s Global EV Outlook dataset.
Summary of Green Technology Utilization
Green technology utilization in APAC economies varies widely. Analyzing new electricity generation capacity and NEV stocks, data show three buckets of APAC economies:
- High utilization: India and Viet Nam have relatively high utilization rates of green technology for both electricity and NEVs. Australia has high utilization rates for electricity.
- Medium utilization: Malaysia and Pakistan have medium utilization for electricity, while Thailand, Australia and the Philippines show intermediate levels of NEV adoption.
- Lower utilization: Bangladesh and Indonesia are mostly dependent on non-green technologies in their expansion of electricity and transportation.
Green Technology Trade and Trade Dependencies in APAC Economies
Green Technology Trade in APAC Economies
Trade in green technologies, including New Energy Vehicles (NEVs) and energy (including solar, wind, other low-carbon technologies such as nuclear, as well as grid transmission equipment), has grown rapidly across APAC economies over the past 10 years.
The figure below shows how APAC economies can be distinguished into three groups regarding their green technology trade since 2002:
- Net importing economies: Australia is the largest net importer of cleantech, growing most rapidly in the EV/battery sectors. Pakistan and Bangladesh are similarly mostly importing and not exporting green technologies, with Pakistan increasing its renewable electricity imports rapidly over the last few years. This is similar to the Philippines, which has rapidly expanded its imports of energy-related equipment since 2025.
- Import-export economies: Several APAC economies are both importing and exporting substantial values of green technologies. This includes Thailand, Indonesia and India. Green-technology trade patterns shifted in 2025, coinciding with new US trade restrictions affecting selected products. This led to significant falls in exports from Thailand. Meanwhile, India witnessed a surge in imports of EVs and renewable energy technology with relatively flat exports. Indonesia saw a near doubling of exports compared to 2024. Some of this is the U.S. market for solar and battery exports (explored below) and the intermediate inputs to fuel this manufacturing growth.
- Export-oriented countries: Viet Nam and Malaysia have expanded exports over the past five years, coupled with imports of intermediate components. Changes in export regimes driven by U.S. trade restrictions also affected green technology exports from Viet Nam and Malaysia in 2025.
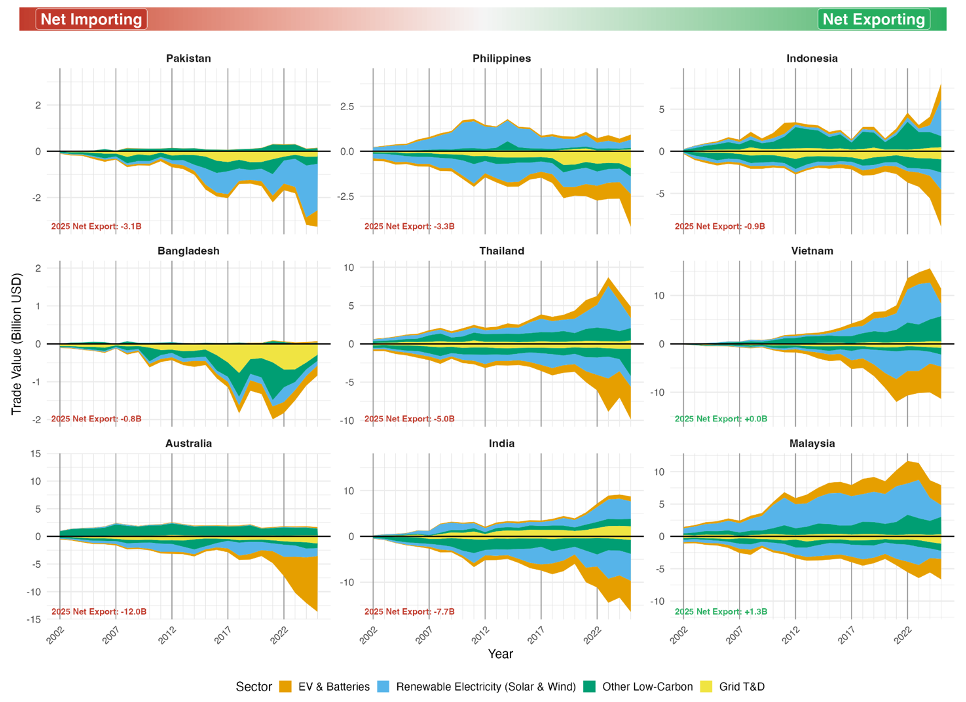
Source: Authors’ calculations using CEPII-BACI for 2002–2024 and harmonized UN Comtrade and General Administration of Customs of China data for 2025.
Note: Exports are shown above zero and imports below zero. Economies are ordered from net-importing to net-exporting. Trade values are reported in current USD.
APAC Green Technology Trade Dependencies
China has emerged as the world’s most important source of green technologies, which also includes APAC economies.
The figure below shows how different APAC economies are dependent on China as a source of their green technology imports in 2025. For example, 99% of Pakistan’s solar equipment imports came from China. Similarly, all APAC economies sourced over 60% of their NEVs and battery imports from China (with the exception of Malaysia for batteries).
While these data show high supplier concentration on China providing the majority of imports of green technologies, the data do not, on their own, measure broader economic dependence on Chinese suppliers as domestic suppliers might also provide significant shares of green technology.
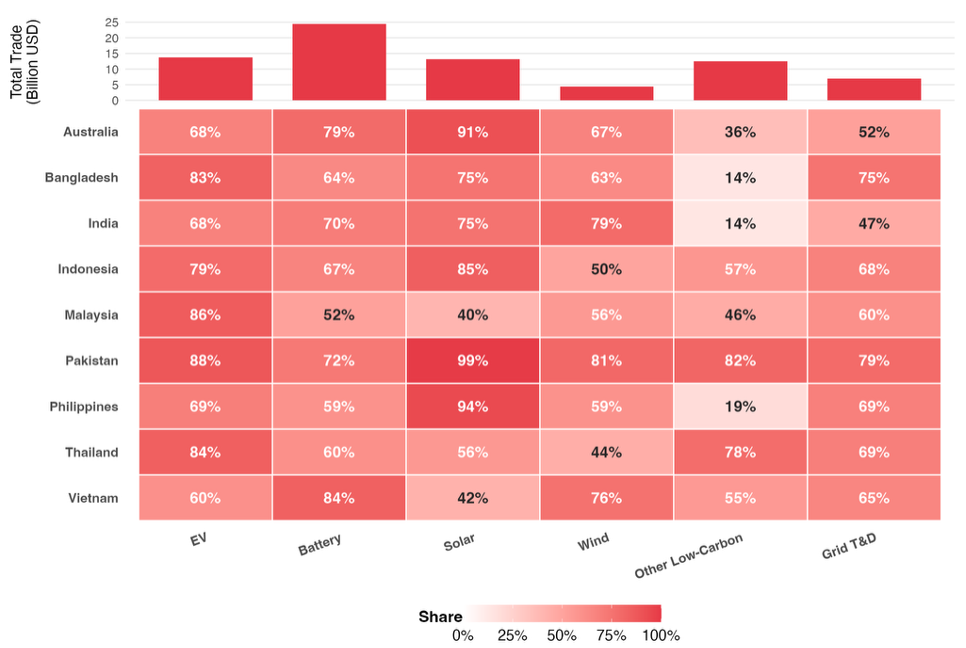
Source: Author calculations using UN Comtrade and GACC harmonized (2025).
Note: This figure displays economies’ dependence on Chinese products in LCT technologies as a share of their total imports in that category. Economies might have lower economic dependence on China LCT depending on their domestic capabilities.
The U.S. is a key destination for LCT exports among the countries considered. For solar products, several countries are reliant on the U.S. for more than half of their exports (see below). Indonesia, Malaysia and Thailand are particularly dependent on the U.S. as an export destination for solar, with the country also accounting for a substantial share of India’s LCT exports across product categories. These patterns suggest that, beyond China’s dominant role as a source of LCT imports, the U.S. plays a central role as the destination market for LCT products exported by several of these countries.
At the same time, trade relations with the U.S. represent a large source of volatility. Changes in trade in 2025 are, in large part, due to increasing import tariffs by the U.S., which shifted preferred export origins from traditional suppliers (Viet Nam, Thailand, Malaysia) to newer suppliers (Indonesia). In particular, for Viet Nam, the U.S. accounted for 79% of solar exports in 2024, but this share fell to 40% in 2025 following the introduction of tariffs. However, this may not be a permanent change, as the U.S. put tariffs in place on Indonesian solar exports in late 2025, which has suppressed exports in the first half of 2026.
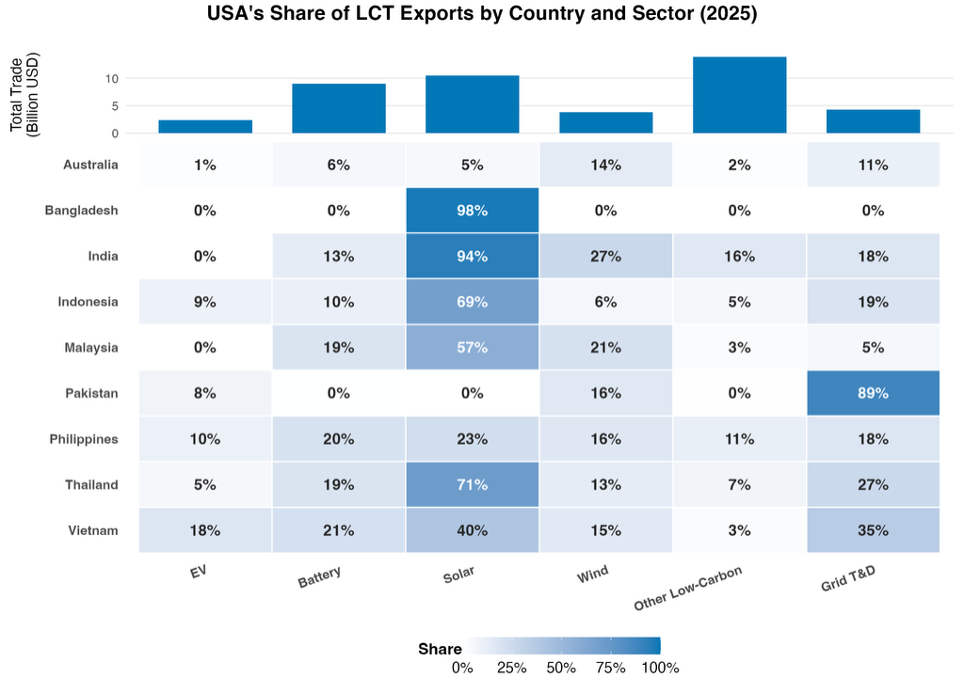
Source: Author calculations using UN Comtrade and GACC harmonized (2025).
Note: This figure displays economies’ dependence on the USA in LCT technologies as a share of their total exports to the USA in that category. Economies might have lower economic dependence on the USA depending on their domestic capabilities.
Green Technology Manufacturing Investments in APAC and the Role of China
As the trade data above show, APAC economies have been integrated into international green technology supply chains as exporters driven by local manufacturing capabilities.
Green Technology Manufacturing Investment Trends
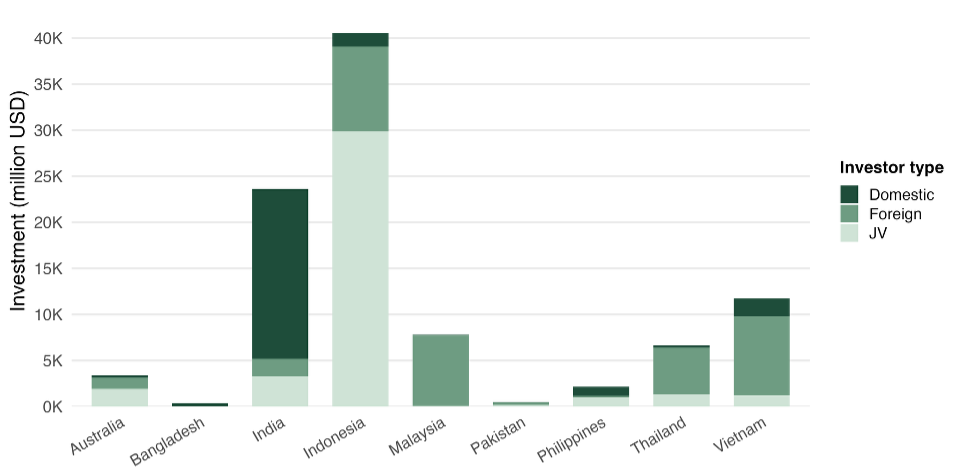
The figure below shows cumulative investment announcements in APAC economies from 2015 to 2026 H1. Indonesia and India attracted the largest announced investment volumes, followed by Viet Nam, Malaysia, Thailand and Australia, with Indonesia topping the ranking at approximately USD 40 billion. Foreign entities participated in projects representing more than 90% of Indonesia’s announced investment value. This contrasts with India, where domestic companies dominate investment announcements.
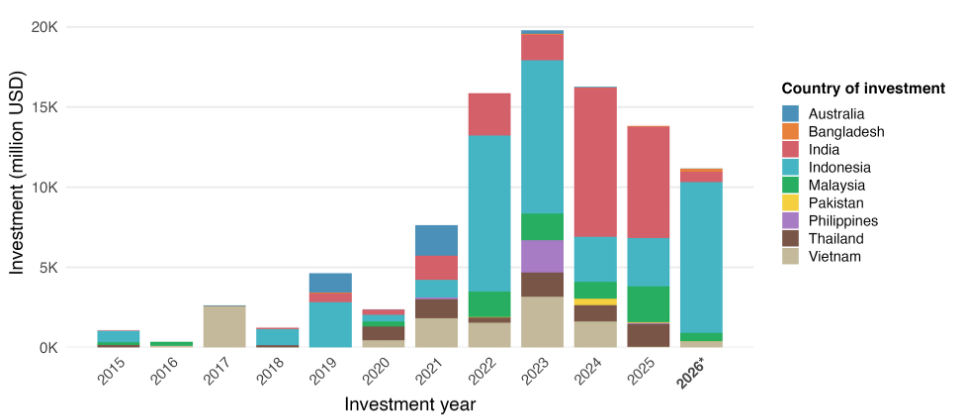
The figure below shows investment announcements in green technology manufacturing from 2015 to 2026 H1 across sectors in energy (batteries including minerals refining, electric solar PV and wind technology) and transport (electric vehicles) in 9 APAC economies. Investment announcements have accelerated particularly since 2021. In the first half of 2026, total investment announcements in green tech manufacturing reached almost USD 11 billion, led by Indonesia and India.
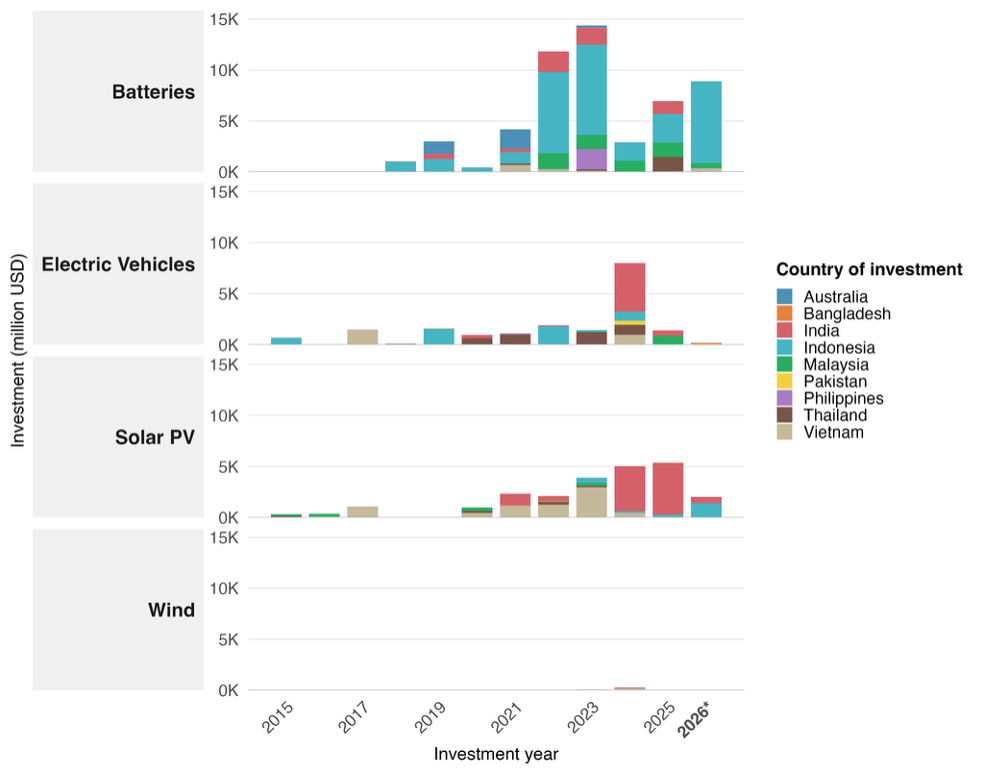
The figure below shows that investment announcements are particularly pronounced in the battery sector, with 2026 H1 showing exceptional growth driven by Indonesia. Similarly, investment in manufacturing related to solar PV is growing steadily across the region, with investments particularly in Indonesia and India. Meanwhile, investments related to the manufacturing of electric vehicles and wind are negligible over the past 18 months, whereas previously India and Indonesia saw significant investments.
The figure below locates solar PV manufacturing announcements within the value chain. Most investment has occurred downstream, e.g., for final assembly of modules or packaging. This is consistent with trading patterns for countries in the region, where most traded value occurs in the downstream segments, e.g., importing cells and assembling into modules. More recently, upstream solar PV manufacturing investment announcements, including projects involving silicon and other processed inputs, have become more prominent in India.
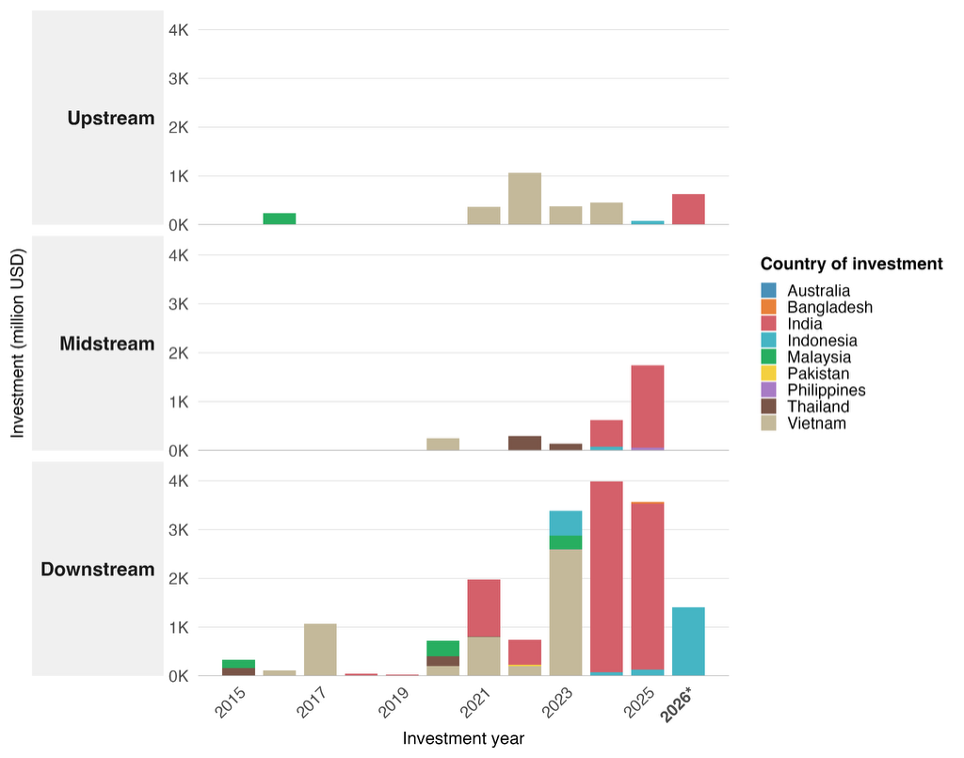
Note: Upstream includes raw materials and processed inputs; midstream includes components used in subsequent manufacturing or assembly; downstream includes finished and market-ready products. Investment values are in USD million; undisclosed values are treated as zero. Data for 2026 cover January–June.
China’s Role in APAC Economies’ Green Technology Manufacturing Investment
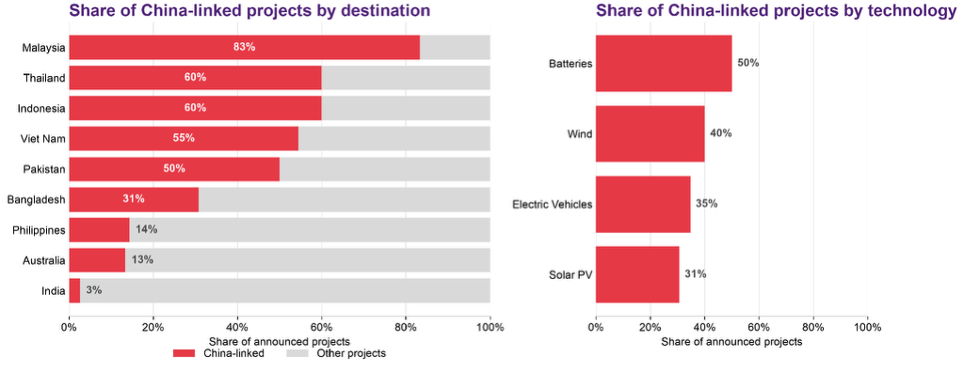
Chinese companies are global leaders in green technologies in energy and mobility. The Figure below shows that Chinese companies also play a significant role in green technology manufacturing projects announced across APAC economies, although their participation varies considerably by destination. In Malaysia, 83% of all announced projects involved Chinese participation, compared with 60% in both Thailand and Indonesia. By contrast, Chinese participation was particularly limited in India (3%), despite its substantial number of domestic green technology manufacturing projects.
The share of Chinese companies varies across different green technologies. Chinese participation was highest in battery manufacturing (50%), followed by wind (40%), electric vehicles (35%) and solar PV (31%).
Pathways in APAC’s Green Economic Transition
Drawing on the preceding analyses of green technology utilization, trade, and manufacturing, Error! Reference source not found. maps APAC economies into five distinct green economy transition pathway categories.
- Import-dependent economies that utilize green imports to strengthen the green economic transition without relevant domestic green manufacturing
- Self-consumption economies that build green manufacturing capacity for domestic use
- Local value-adding economies that have significant green manufacturing capacity (mostly assembly) to add value to imported semi-finished products for export
- Comprehensive green economies that have built a strong green ecosystem that boasts green manufacturing capacity with strong domestic utilization and trade
- Low-intensity transition economies without significant focus on any green transition factor.
Import-Dependent Economies
Import-dependent economies have limited domestic clean energy manufacturing capacity and rely primarily on foreign suppliers for the technologies required for deployment. Australia, Pakistan and the Philippines have relied substantially on imported green technologies to support domestic deployment, while maintaining relatively limited domestic manufacturing capacity. In Australia, domestically manufactured solar panels accounted for only around 1% of installations in 2024, while 5.9 GW of new renewable generation capacity was added in 2025. Similarly, Pakistan imported approximately 16.6 GW of solar panels from China in 2024, supporting rapid solar deployment, particularly in behind-the-meter installations. The Philippines has also expanded its imports of renewable energy equipment, particularly solar technologies, alongside recent growth in renewable energy deployment. This pathway allows these countries, in principle, to benefit from declining green technology costs on international markets without bearing the costs of establishing a domestic manufacturing industry. Import dependence can thus represent a pathway of accelerating green technology deployment while not relying on domestic production capacity.
Self-Consumption Economies
India is an example of a self-consumption economy, combining large-scale domestic deployment with expanding manufacturing capacity and substantial imports of both intermediate and finished products. This structure enables domestic value addition while reducing, but not eliminating, dependence on imported finished technologies.
Local Value-Adding Economies
Local value-added economies are those that have developed domestic clean energy manufacturing capacity based on identifying export opportunities into international supply chains rather than driven by domestic utilization. These economies both import and export clean energy products and attract investment in manufacturing capacity but do not necessarily expand green technology utilization in these sectors.
Malaysia and Thailand exhibit more export-oriented manufacturing profiles alongside comparatively lower domestic deployment. Indonesia has attracted substantial announced manufacturing investment, particularly in batteries. However, its domestic deployment and clean-technology trade remain less developed than its investment pipeline. Indonesia therefore shows emerging characteristics of a local value-adding economy.
Comprehensive Green Economies
Viet Nam is an example of a comprehensive green economy in the APAC economies, owing to green energy and green mobility build-out, high levels of manufacturing investment, and significant trade volumes (particularly as a percentage of total traded goods). Viet Nam has developed green technology manufacturing capacity while becoming integrated into international trade networks for green technologies. Its manufacturing sectors can rely on imported intermediate and upstream inputs while producing goods for foreign markets.
Low-Intensity Transition Economies
Bangladesh can be classified as a low-intensity transition economy, characterized by limited domestic clean technology manufacturing and relatively modest levels of deployment, but with growing reliance on imported clean technology products. It has not experienced a large take-off in imports and utilization of green technologies. Increasing imports provide a potential channel through which deployment can expand relatively quickly in certain sectors.
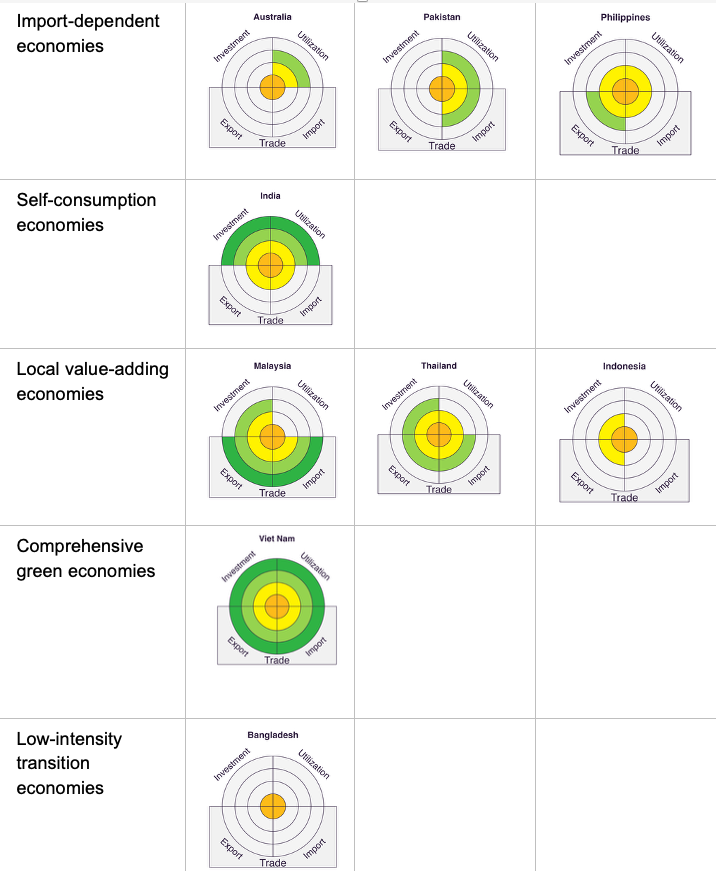
Sources: Authors’ calculations using CEPII-BACI for trade, the University of Queensland Asia Cleantech Investment Tracker for manufacturing investment, Ember’s Yearly Electricity Data for capacity additions, and World Bank World Development Indicators for GDP.
Note: Manufacturing investment, utilization, imports and exports are normalized by average GDP over 2015–2025. Positive values are assigned to quartiles within the nine-economy sample: four rings indicate the highest quartile and one ring the lowest. A score of zero indicates no identified activity or reported value.
Recommendations and Conclusion
The green economic transition is underway across Asia-Pacific economies but with significant differences in the pathways and pace. For example, India, Viet Nam and the Philippines have both combined relatively strong renewable energy deployment with growing manufacturing activity, although India’s manufacturing is more domestically oriented, while Viet Nam has developed broader participation in international green technology value chains. Malaysia and Thailand have developed more export-oriented manufacturing profiles, while Australia and Pakistan have expanded renewable capacity primarily through imports. Bangladesh shows relatively low activity across deployment, trade and manufacturing indicators. Indonesia presents a different profile: domestic deployment remains relatively low and its trade position is mixed, but it has attracted exceptionally large manufacturing investment announcements, particularly in batteries. This places Indonesia within the local value-adding pathway, although announced investment has yet to translate fully into operational manufacturing capacity and domestic value creation.
Table 1 summarizes the green economic transition pathways based on the identified data and highlights the key opportunities and risks associated with each transition type. For example, import-dependent economies, such as Australia, Pakistan and the Philippines, can benefit from access to affordable imported technologies to accelerate deployment, but face risks associated with supplier concentration. Accordingly, these economies should diversify their sources of supply while exploring value-chain opportunities in niche sectors, such as green technology recycling.
Table 1: Green Economic Transition Pathways in APAC.
| Transition pathway | Indicative economies | Core opportunity | Key risk | Action focus |
| Import- dependent | Australia, Pakistan, the Philippines | Rapid deployment through access to competitively priced imported technologies | Supplier concentration, external supply disruptions and exposure to trade restrictions | Diversify import sources, strengthen supply-chain resilience and develop competitive niches such as recycling and maintenance |
| Self-consumption | India | Domestic demand supports industrial scale | Cost premiums, protectionism and technology gaps | Link manufacturing support to credible deployment, quality standards and grid readiness |
| Local value-adding | Malaysia, Thailand, Indonesia | Trade links and existing manufacturing ecosystems | Limited domestic value added, weak demand and exposure to trade barriers | Move selectively upstream, expand domestic deployment and strengthen skills, suppliers and innovation |
| Comprehensive green economy | Viet Nam | Broad value-chain participation supported by domestic demand and trade | Rapid technology cycles can erode competitiveness without continuous upgrading | Support an innovation ecosystem and maintain credible domestic and export demand |
| Low-intensity transition | Bangladesh | Build deployment and industrial capability from a low base | Fossil lock-in, financing constraints and weak investment conditions | Prioritize grid-ready deployment, enabling regulation and realistic industrial niches |
The findings point to four practical recommendations.
- Improve understanding of value chain dependency and opportunities at the technology level. Governments should understand import concentration and opportunities for specific products such as solar modules, cells, inverters, battery cells, battery packs, EV components and grid equipment. Risk assessments should distinguish between products that can be sourced readily from alternative suppliers and those for which a single country or supplier dominates global manufacturing capacity.
- Avoid treating a positive trade balance as proof of domestic capability. Net exports can reflect re-exporting, final assembly or foreign-owned export-platform production, which may or may not generate local value. Malaysia and Thailand’s export-oriented profiles should be assessed on their value additions in supply-chain stage, local employment, domestic suppliers and the operating status of manufacturing facilities. They are also often exposed to export fluctuations, including evolving trade barriers.
- Use import diversification selectively, balancing with utilization speed. For all countries, a priority is to preserve access to affordable green technologies while reducing single-supplier exposure.
- Understand local manufacturing capacity and value chain integration. While governments might be tempted to strengthen local manufacturing capability in green technologies, global value chains are highly competitive, with often decreasing unit costs, established logistics and fast-advancing technology. An investment in local manufacturing without sufficient integration in supply chains, innovation cycles and competitive pricing is rapidly lacking competitiveness.
A consistent finding is the central role of Chinese supply. China was the dominant source of imported low-carbon technology products for most economies covered, including in solar equipment, where Pakistan sourced 99% of measured imports from China in 2025. China is also the main source of APAC green technology manufacturing investment, particularly in batteries.
Annex: Methodology
- Green energy utilization data: The report uses data from Ember’s Yearly Electricity Data, which provides electricity generation and capacity data per country-year-electricity source. We calculated capacity additions manually by subtracting the annual reported total capacity per electricity source from the previous year, and performed consistency checks using secondary sources.
- Trade data: Bilateral trade data for 2002–2024 are obtained from BACI. For 2025, bilateral trade flows are constructed by combining each country’s reported trade data from UN Comtrade with China’s trade flows from the General Administration of Customs of China (GACC), harmonizing the resulting flows to match BACI terminology. We reconcile the two reports for each bilateral flow by estimating each country’s reporting reliability from the 2025 data and combining the reported values using reliability-based weights. Freight rates are estimated separately using a gravity equation and used to adjust the raw trade data. To maintain product-level granularity across five HS revisions, we map trade flows from earlier HS vintages to the latest HS revision using the composition of trade in the first year of each new HS revision to construct allocation weights for the corresponding product categories. We develop a new classification of low-carbon technology (LCT) products by cross-referencing multiple existing classification frameworks and manually assigning product codes to three stages of the value chain: upstream, comprising raw materials and other inputs; midstream, comprising intermediate goods and components; and downstream, comprising finished products.
- Cleantech manufacturing investment data: The report uses a project-level dataset developed by the University of Queensland covering solar PV, wind, electric vehicles and battery investments across selected Asian economies and Australia. The dataset includes information on location, technology and value-chain segment, companies and investor origin, investment timing, value, and manufacturing capacity. Projects were identified through systematic country-, technology- and value-chain-specific searches using government, company, industry and reputable media sources. The dataset was also cross-checked against the Rhodium Group Clean Investment Monitor (CIM) and public analyses based on Financial Times fDi Markets to improve coverage and consistency. Reported investment values are used where available; missing values are estimated using project comparables and capacity-based benchmarks.